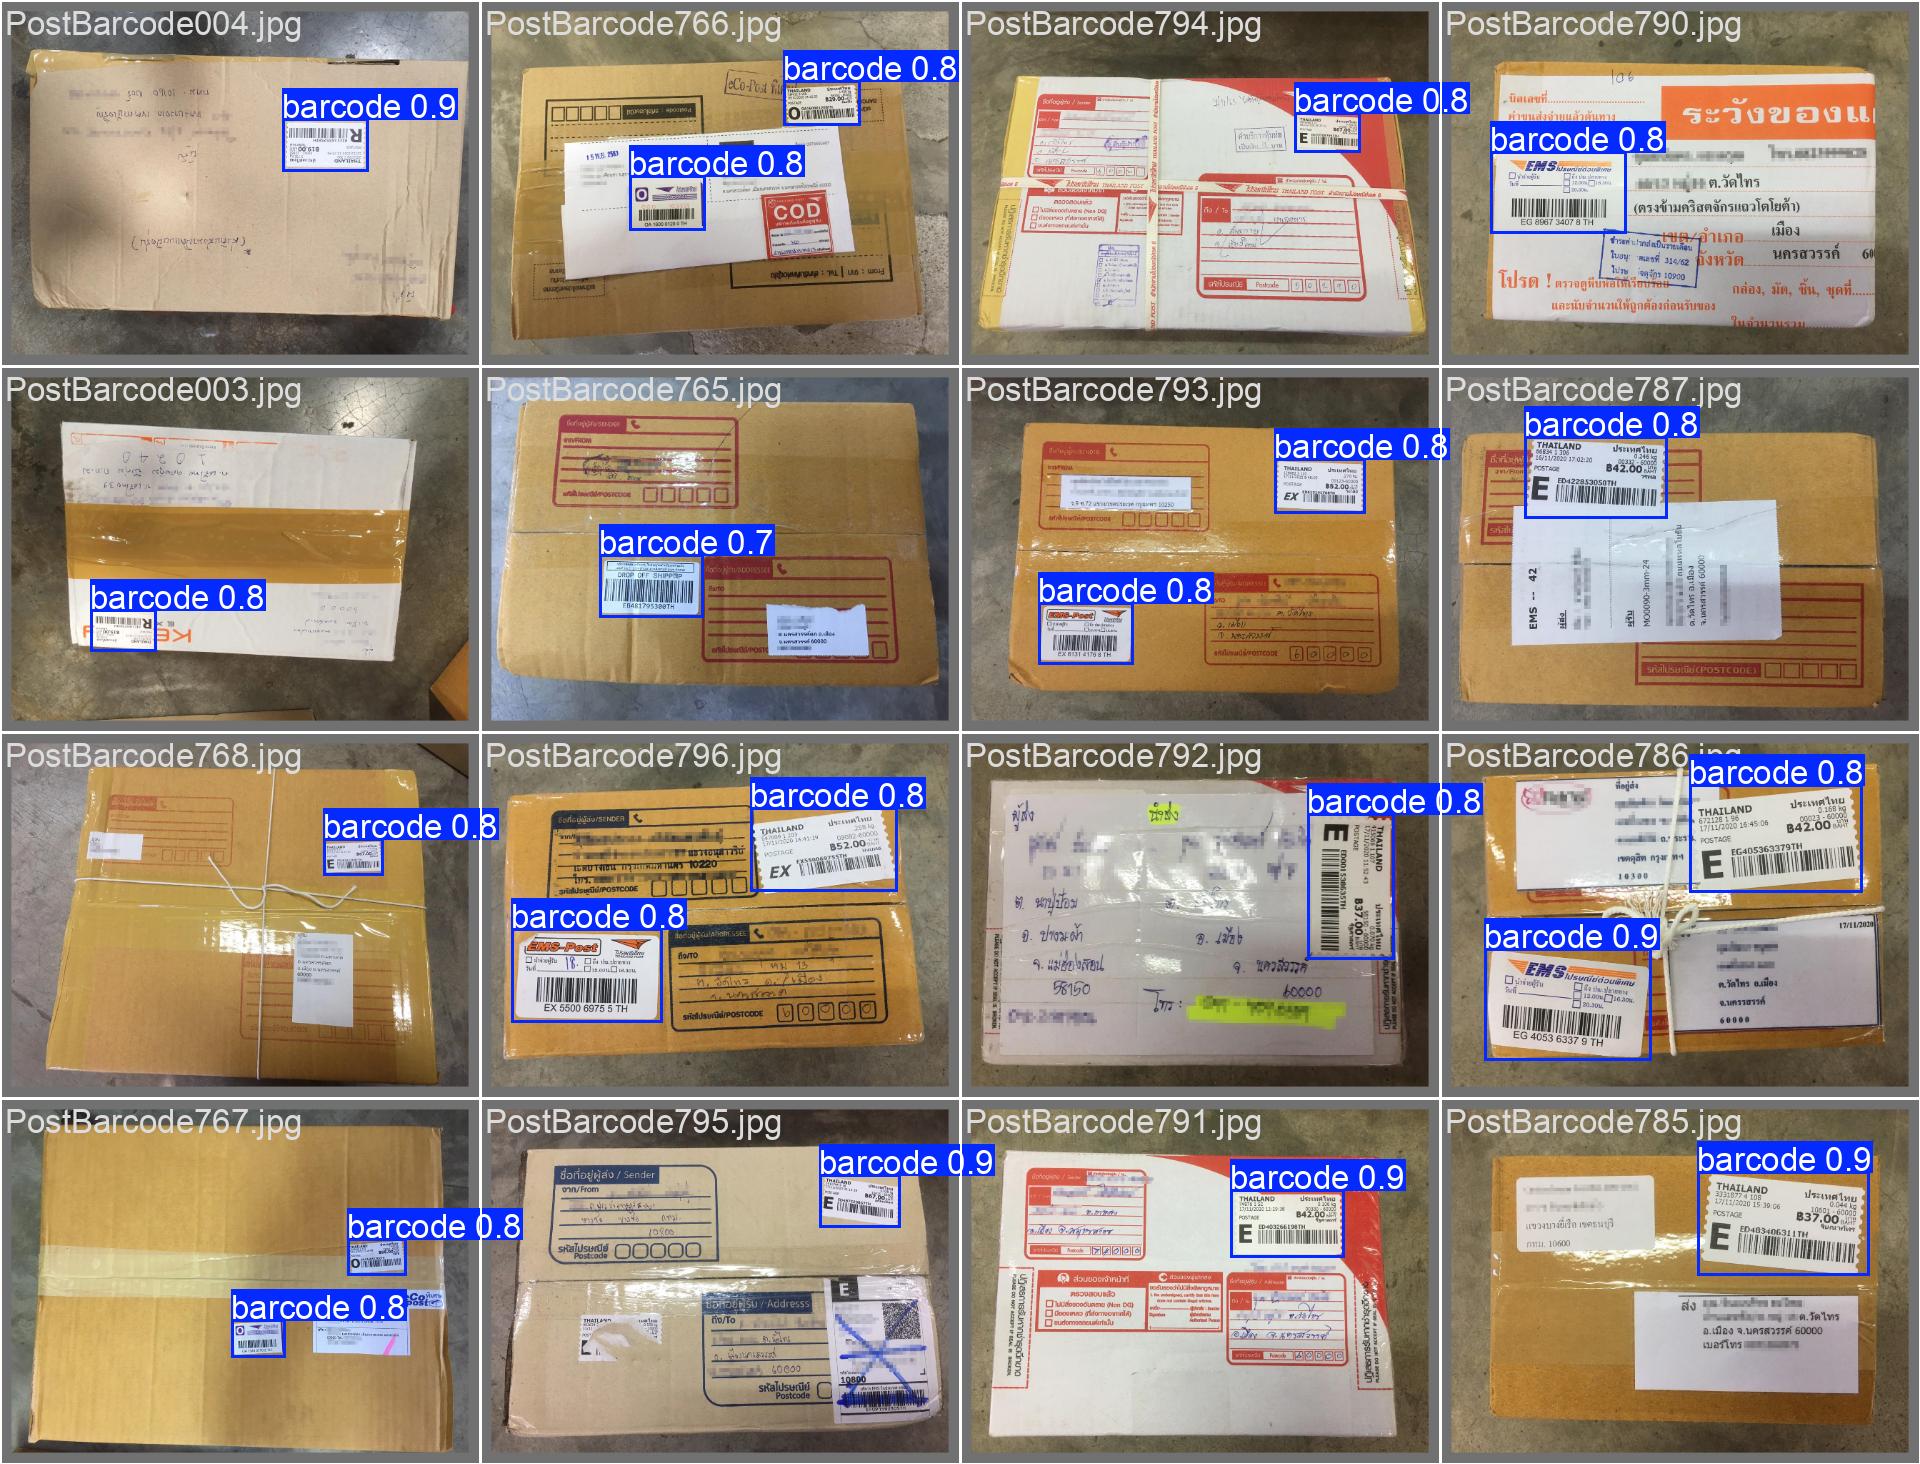
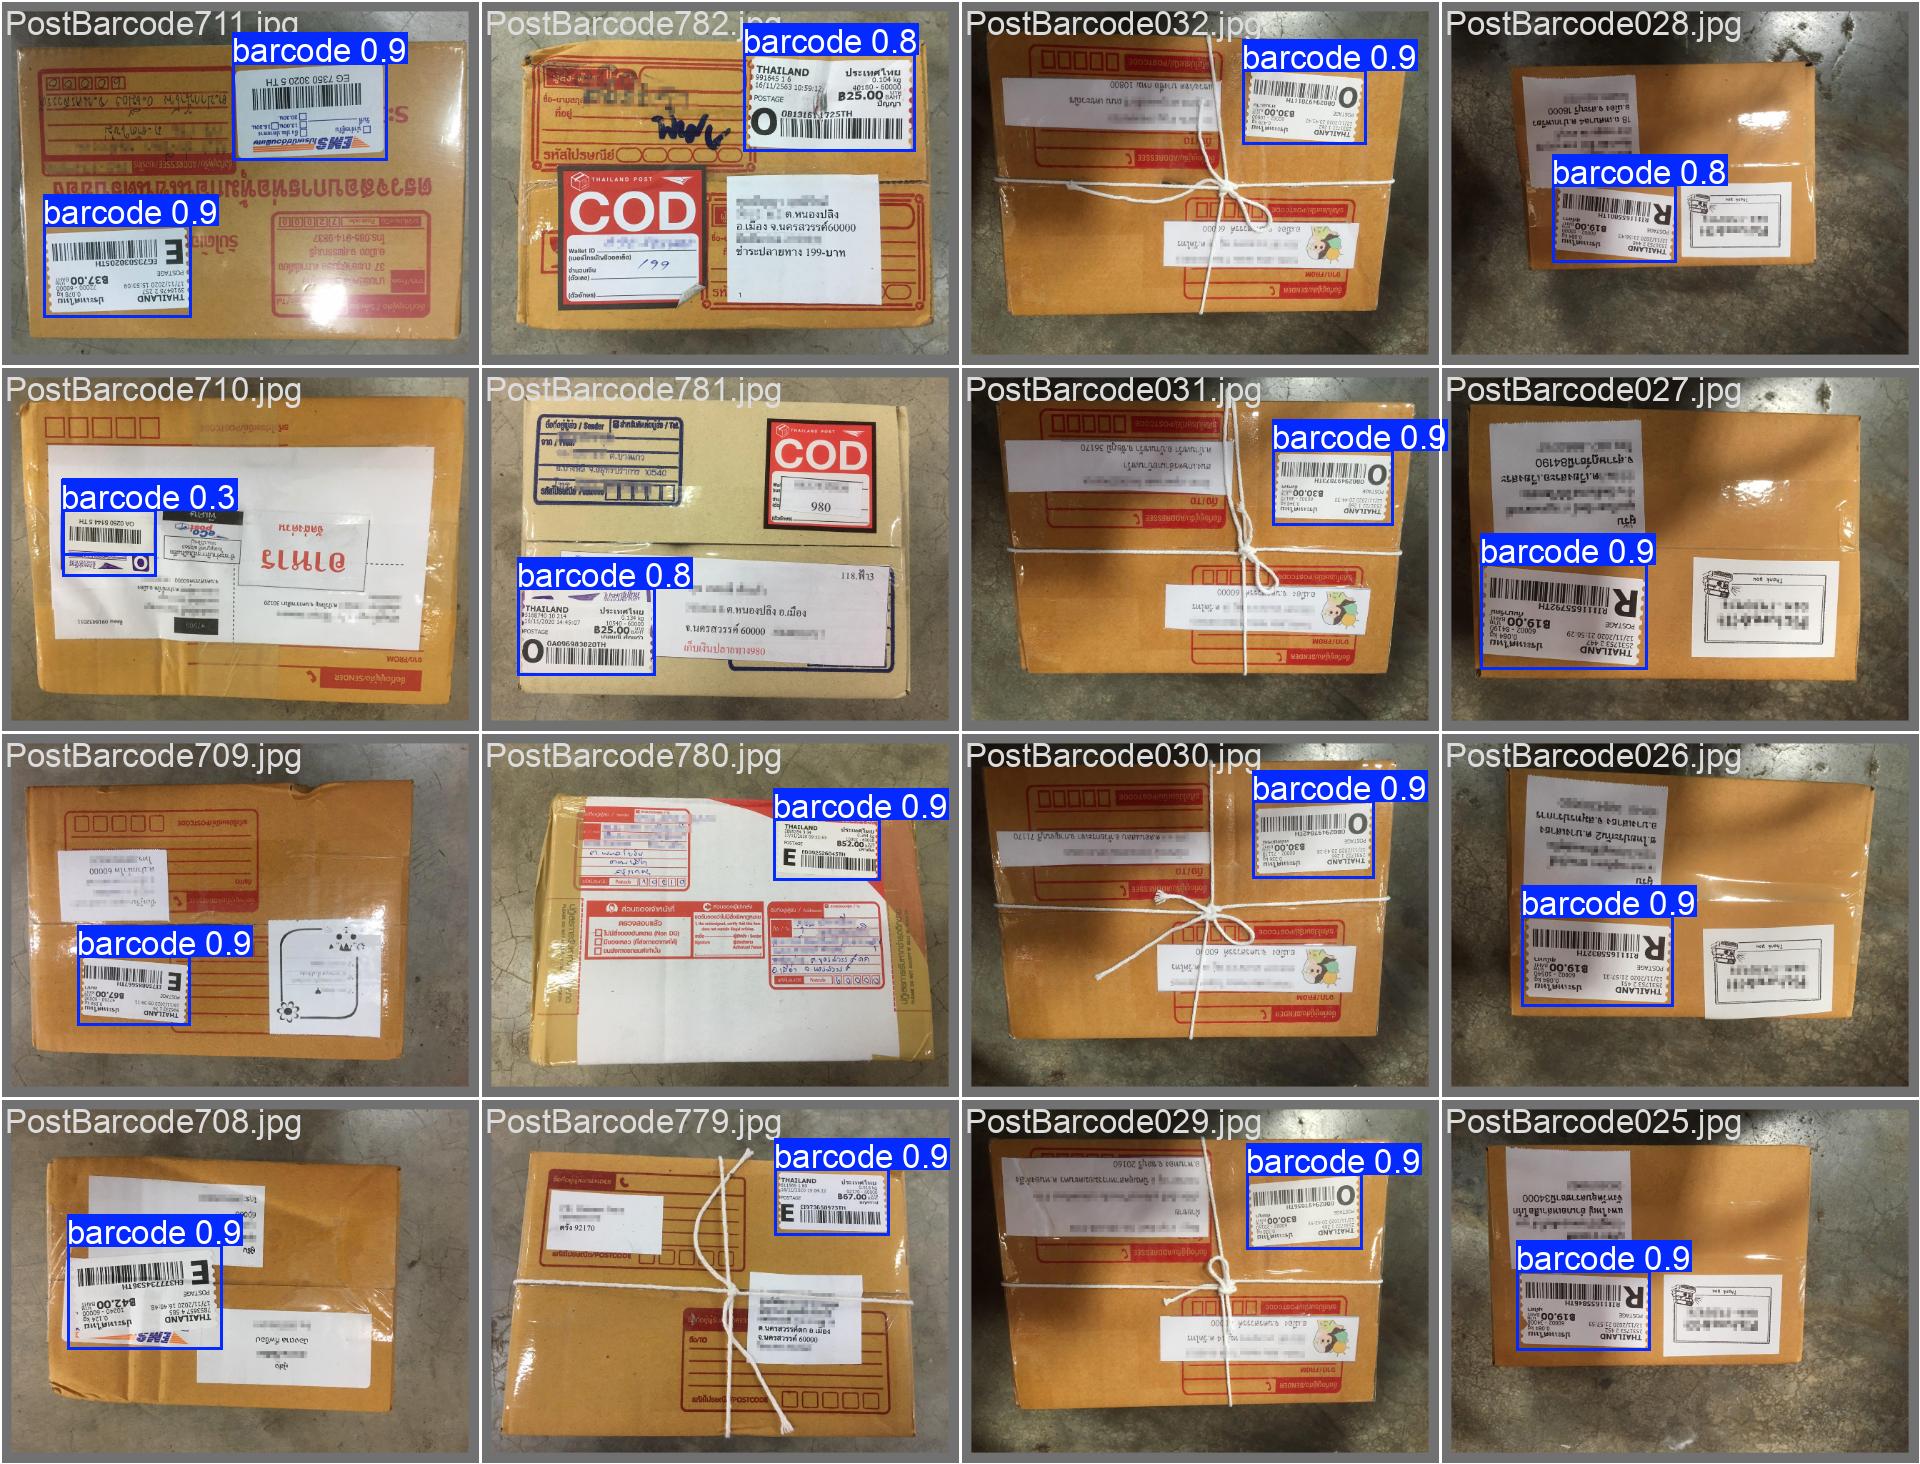
Views
No views yet
ultralytics package, which can be installed via pip. Ensure you have a Python>=3.8 environment with PyTorch>=1.8.pip install ultralyticsyolo command. Make sure the YOLOV8s_Barcode_Detection.pt model file is accessible in your current directory or specified with its full path.yolo predict model=YOLOV8s_Barcode_Detection.pt source='path/to/your/image.jpg'yolo command offers various modes and arguments (e.g., imgsz=640). For more details, consult the YOLOv8 CLI Docs.1from ultralytics import YOLO
2
3# Load your finetuned model
4model = YOLO("YOLOV8s_Barcode_Detection.pt")
5
6# Perform object detection on an image
7results = model("path/to/image.jpg")
8
9# Optionally, visualize the results
10results[0].show()
11
12# You can also export the model to other formats (e.g., ONNX)
13# This is useful for deployment in various environments.
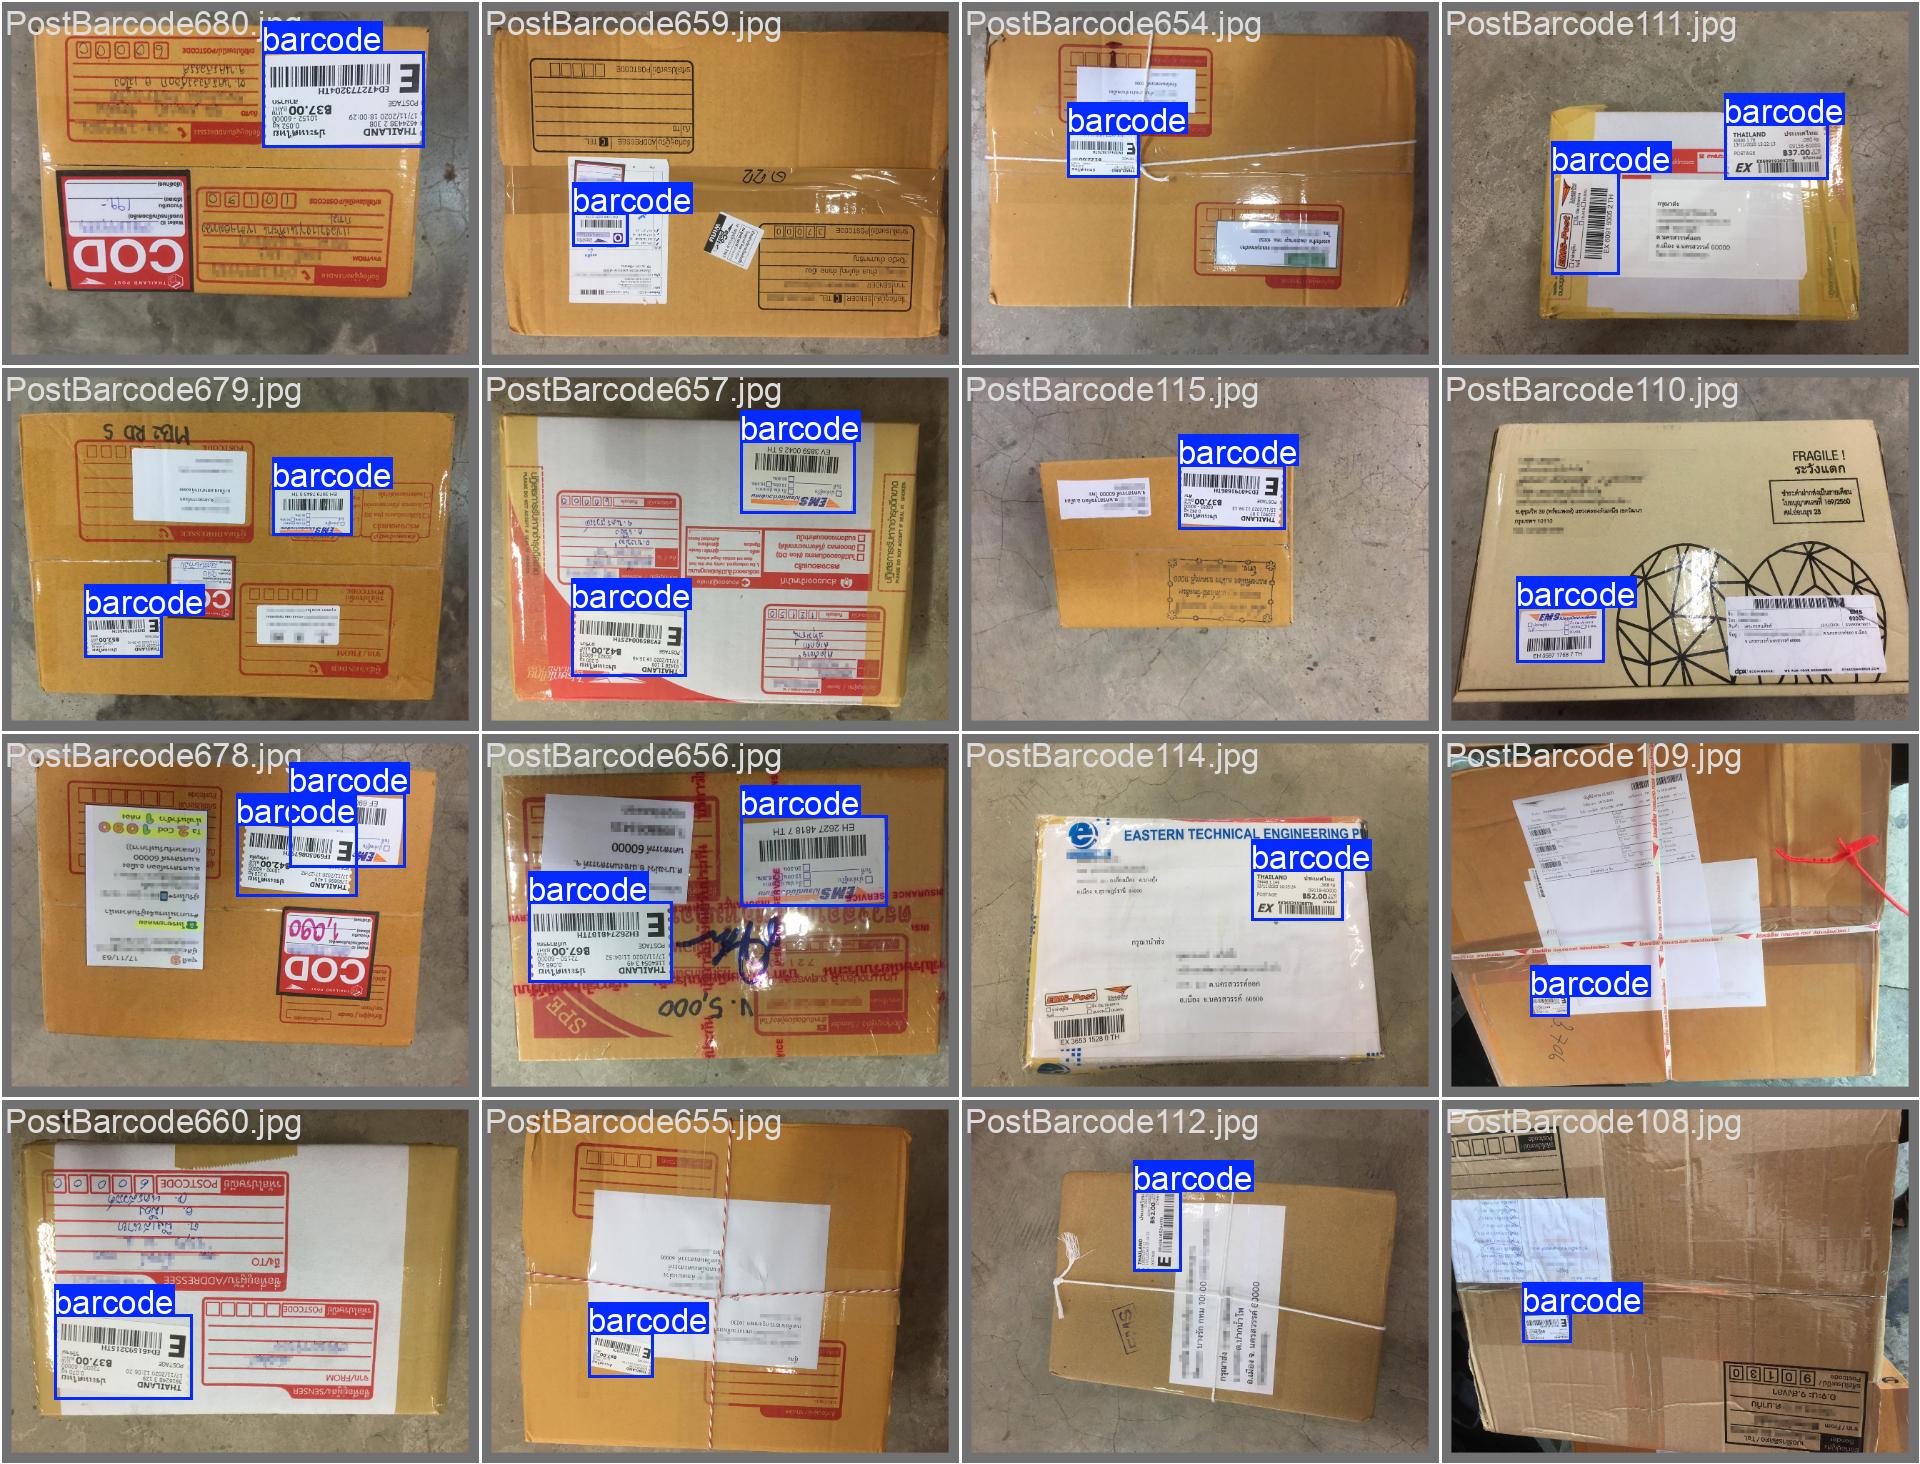
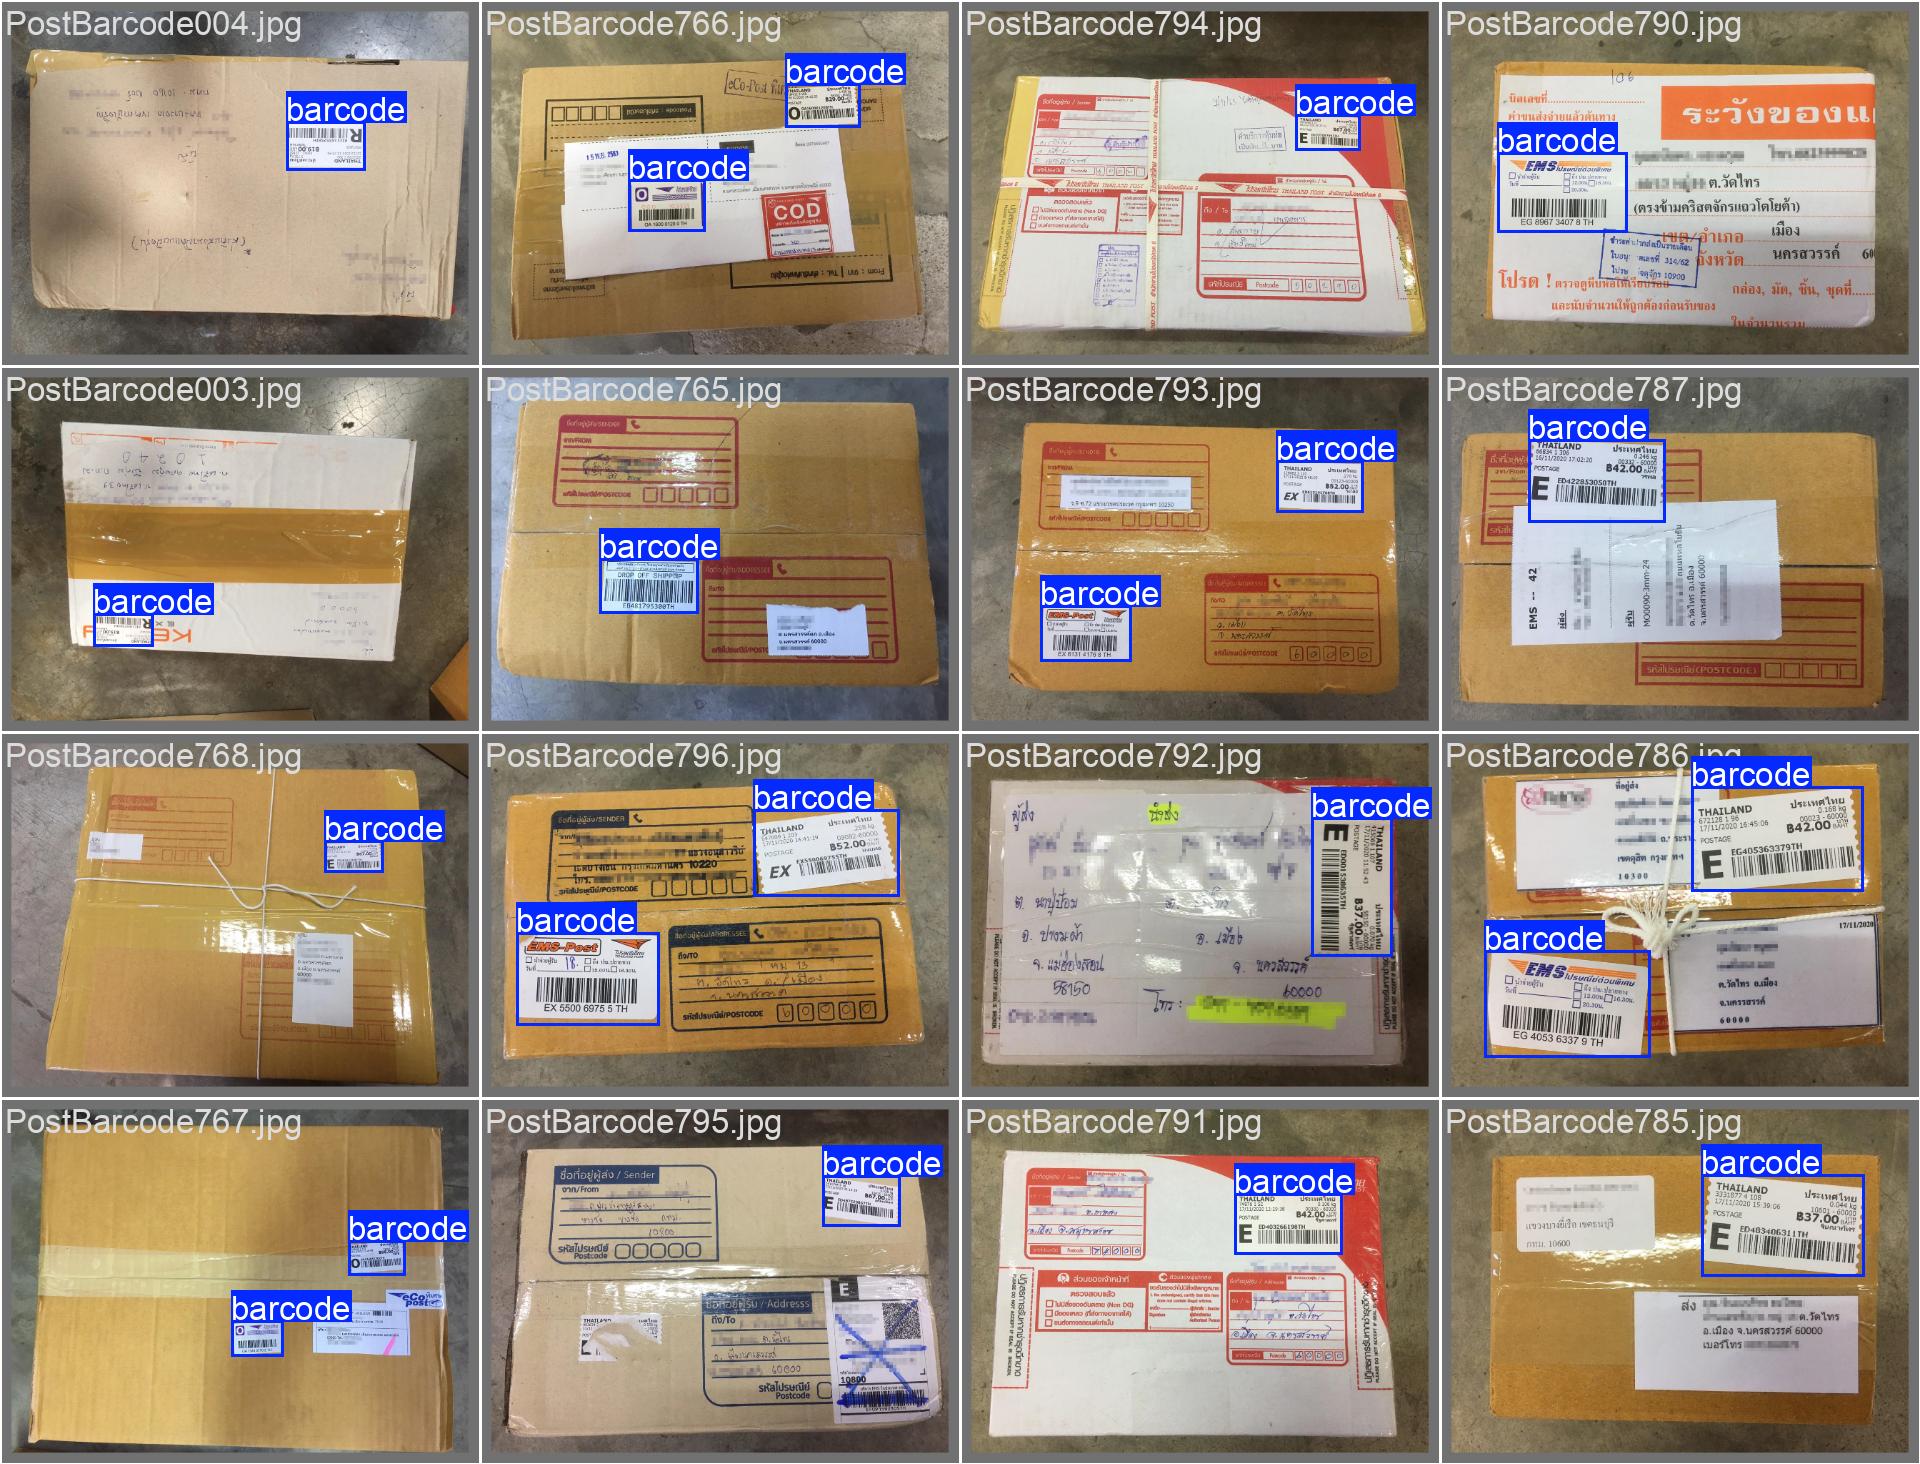
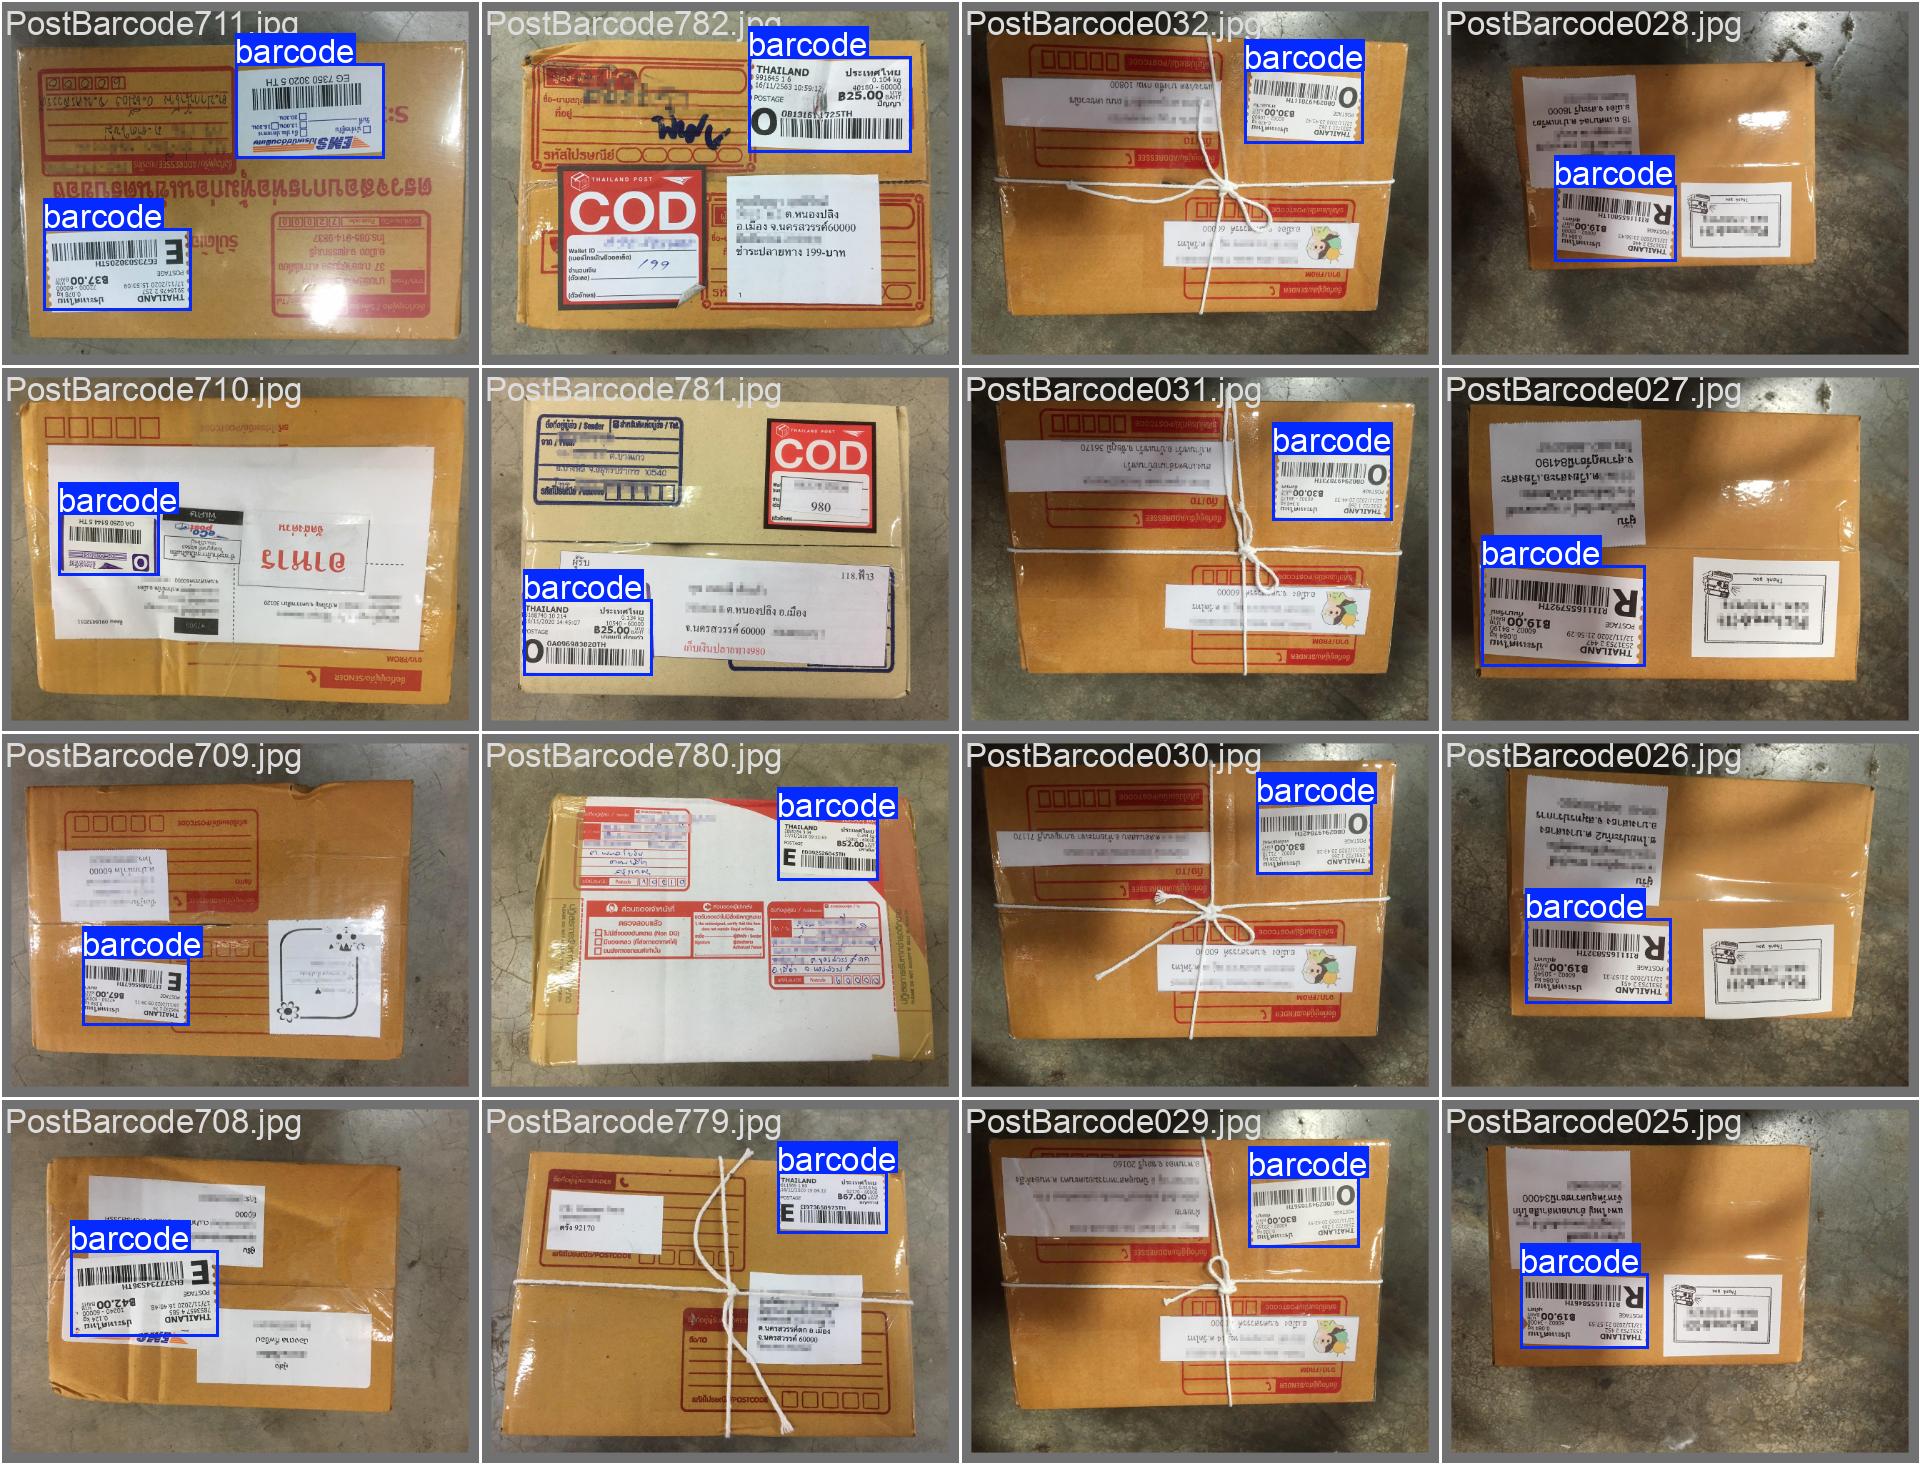
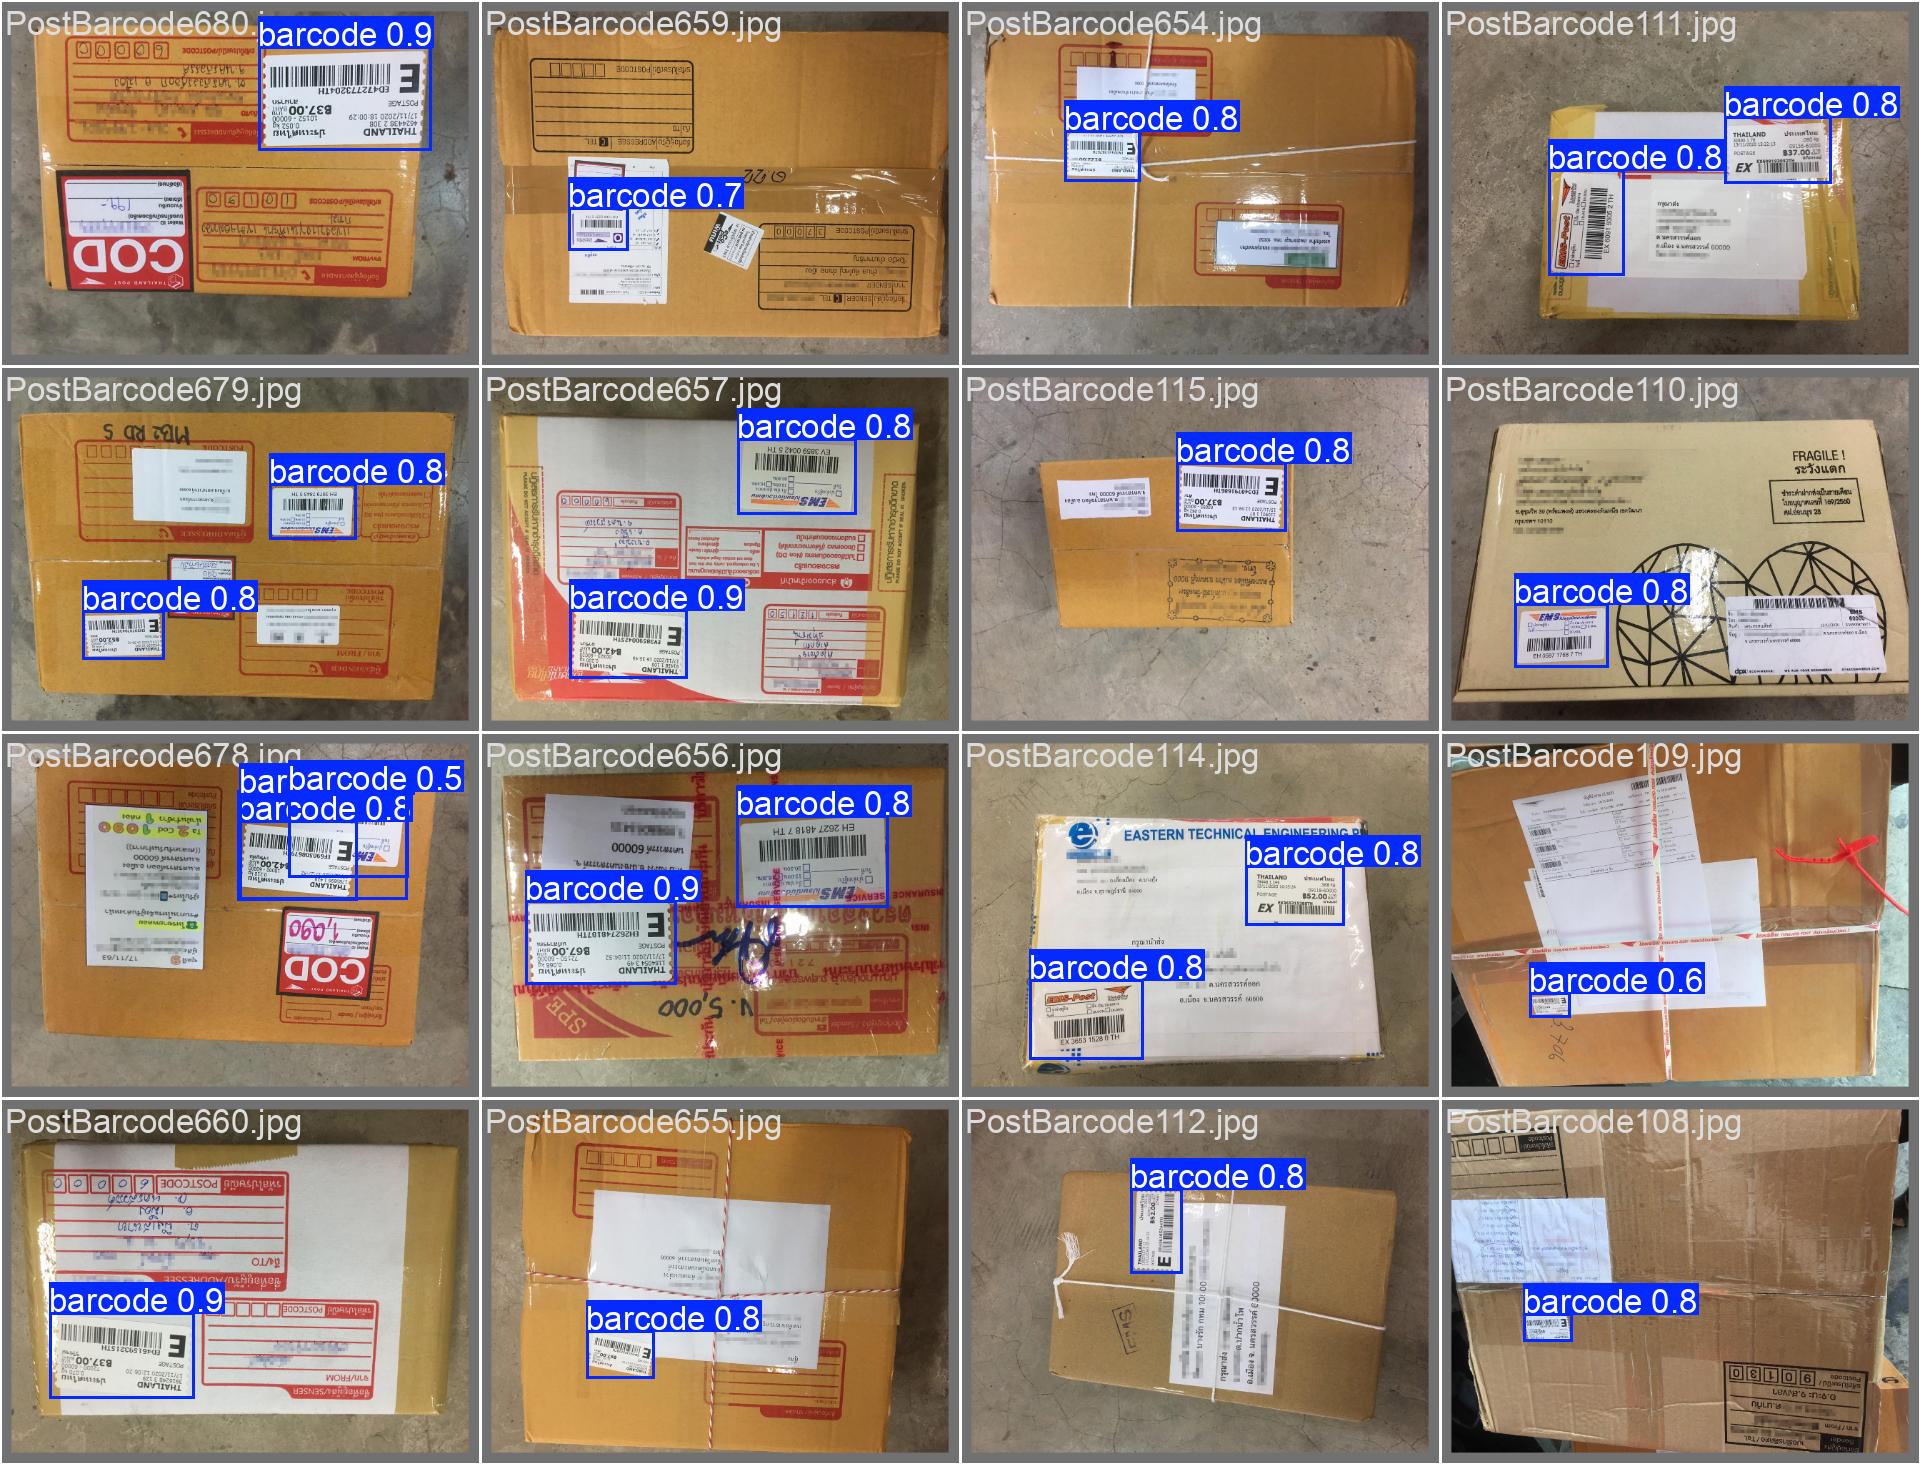
14# path = model.export(format="onnx") # uncomment to exportYOLOV8s_Barcode_Detection.pt, is a finetuned instance of the YOLOv8s (small) detection model. It has been specifically trained for barcode and QR code classification and detection.yolov8s.pt checkpoint and was conducted with the following key parameters:1# Base model used for finetuning
2model = YOLO('yolov8s.pt')
3
4# Training parameters
5results = model.train(
6 data='dataset/data_autosplit.yaml', # Path to the custom dataset
7 epochs=30, # Number of training epochs
8 patience=10, # Early stopping patience
9 batch=16, # Batch size (adjust based on GPU memory)
10 imgsz=640, # Image size for training
11 name='yolov8_large_dataset_v1', # Run name
12
13 # Augmentation parameters
14 degrees=180, # Random rotation (0-180 degrees)
15 translate=0.1, # Image translation (0-1)
16 scale=0.5, # Image scaling (0-1)
17 shear=10, # Image shearing (degrees)
18 perspective=0.001, # Image perspective (0-0.001)
19 fliplr=0.5, # Horizontal flip (probability)
20 flipud=0.5, # Vertical flip (probability)
21 cutmix=0.2, # CutMix augmentation (probability)
22)
YOLOV8s_Barcode_Detection.pt will differ, reflecting its specialized training on barcode and QR code data.| Model | size (pixels) | mAPval 50-95 | Speed CPU ONNX (ms) | Speed A100 TensorRT (ms) | params (M) | FLOPs (B) |
|---|---|---|---|---|---|---|
| YOLOv8s | 640 | 44.9 | 128.4 | 1.20 | 11.2 | 28.6 |
yolo val detect data=coco.yaml device=0yolo val detect data=coco.yaml batch=1 device=0|cpuYOLOV8s_Barcode_Detection.pt model.| Metric | Value |
|---|---|
metrics/precision(B) | 0.97545 |
metrics/recall(B) | 0.99127 |
metrics/mAP50(B) | 0.98643 |
metrics/mAP50-95(B) | 0.77643 |
val/box_loss | 0.988 |
val/cls_loss | 0.43007 |
val/dfl_loss | 1.11172 |
| Plot Type | Description | Image |
|---|---|---|
| F1-Confidence Curve | This curve shows the F1 score across different confidence thresholds for both barcode and QR code classes, as well as the overall F1 score. The peak F1 of 0.98 is achieved at a confidence of 0.553. | 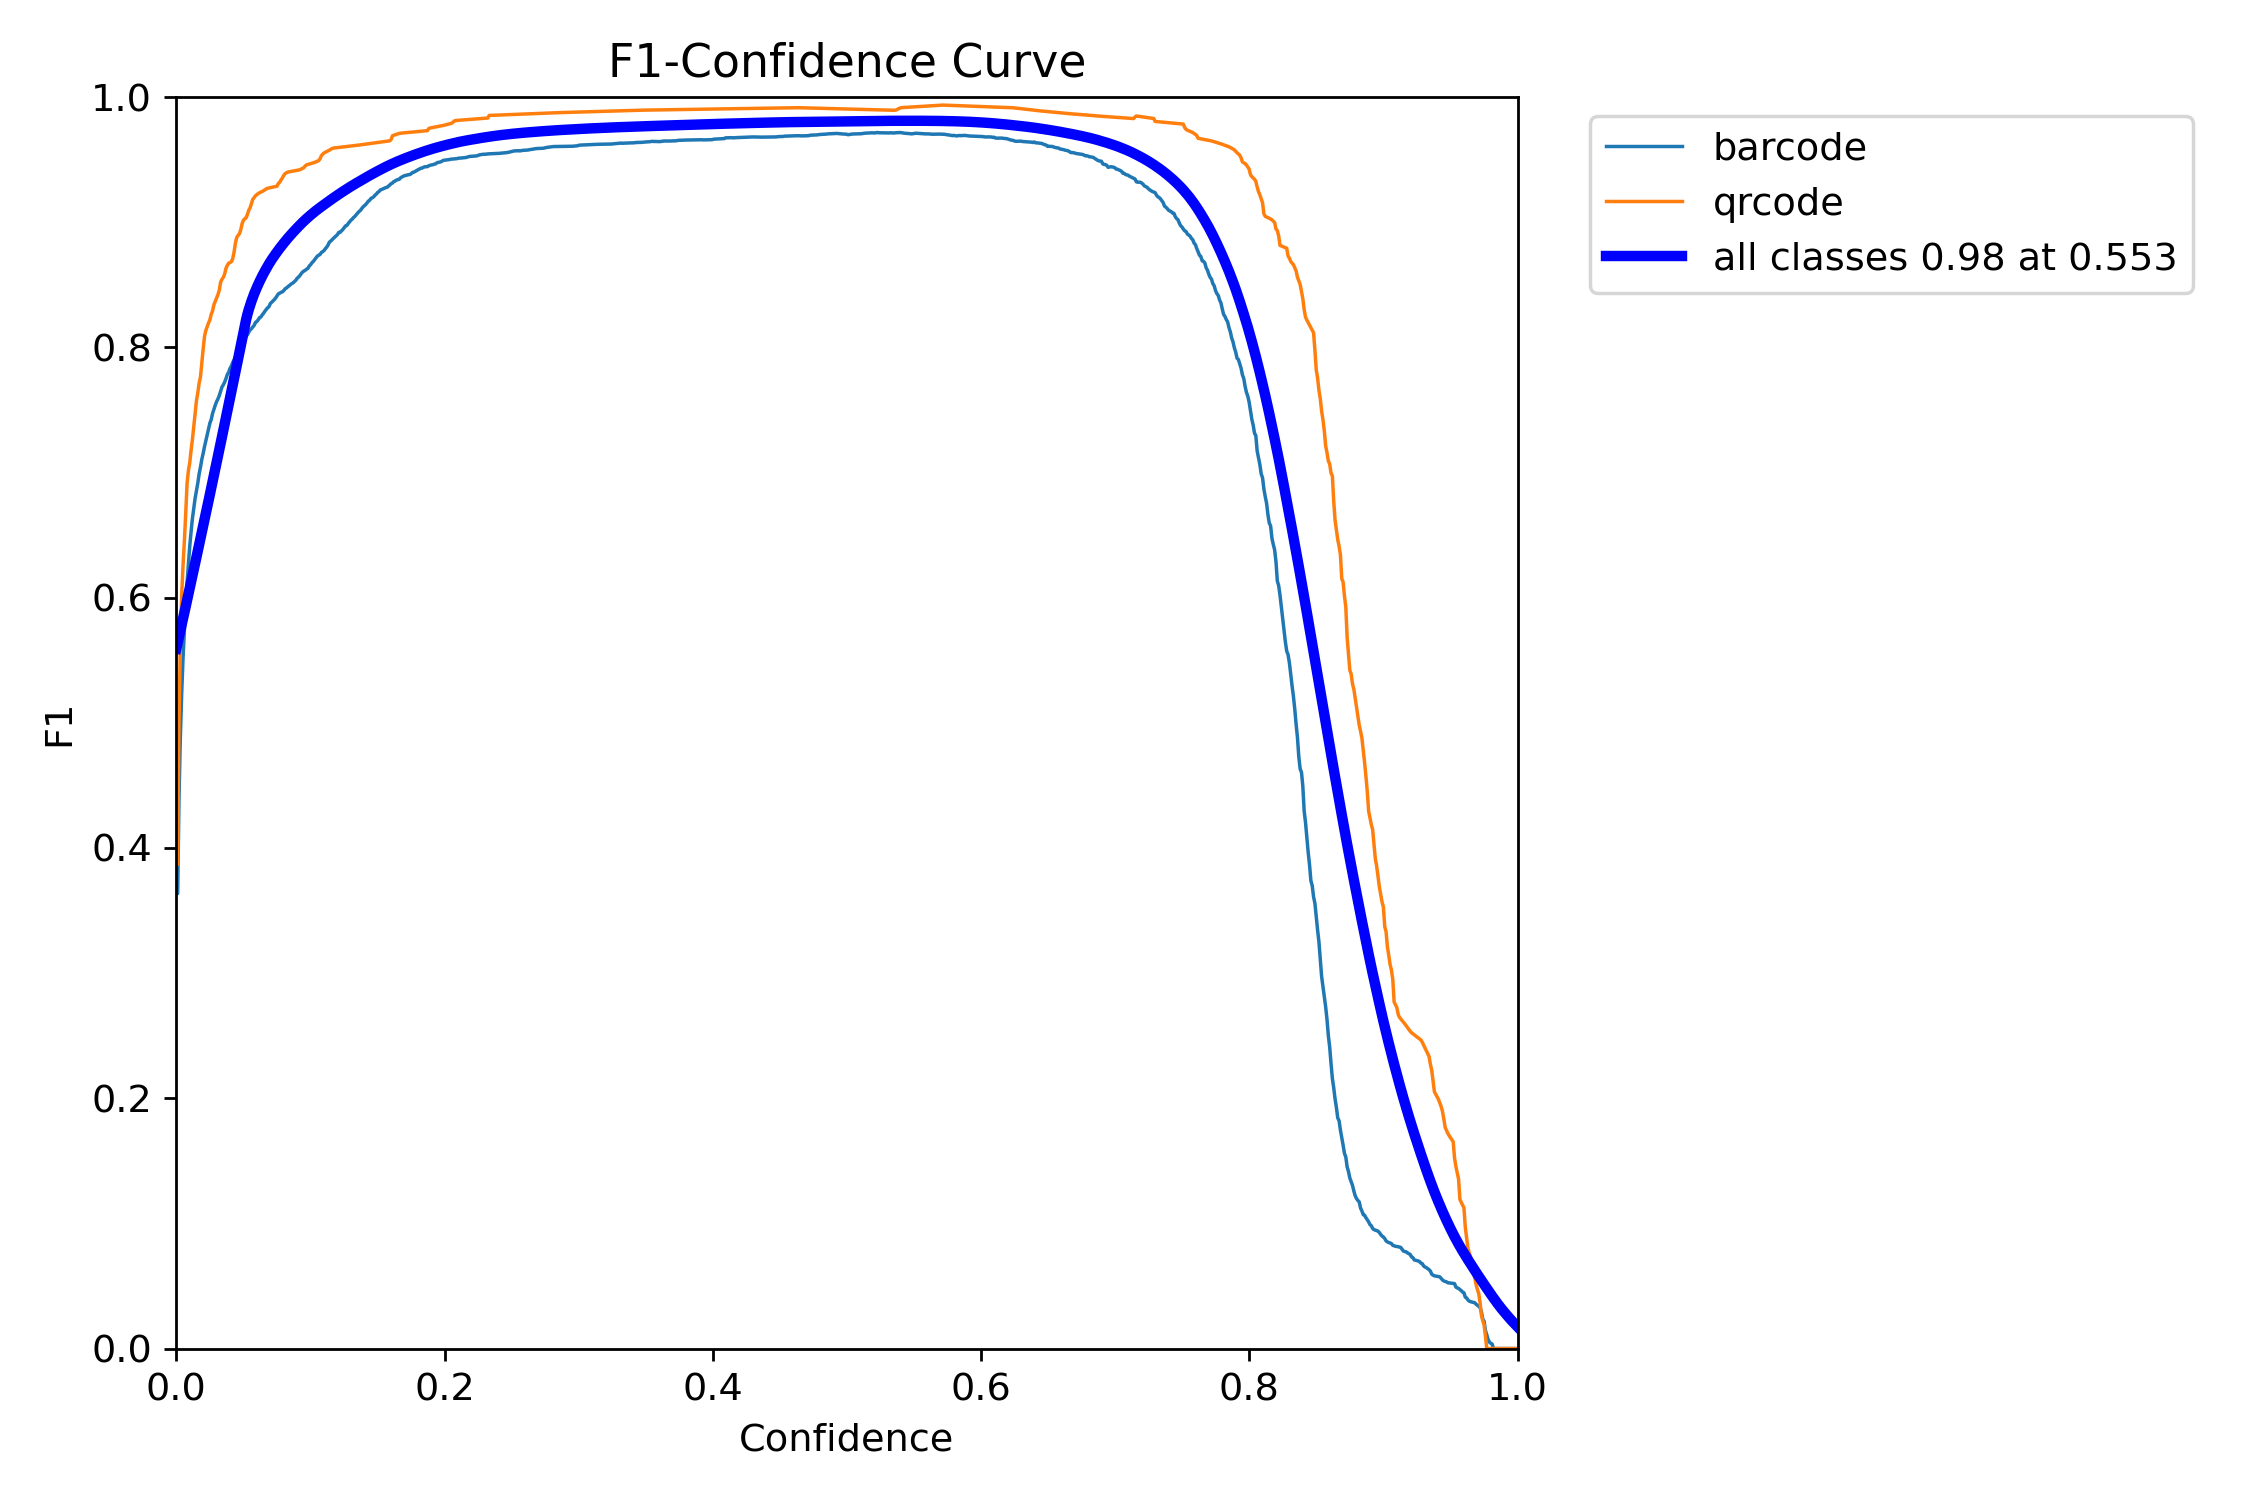 |
| Precision-Confidence Curve | This plot illustrates how precision changes with varying confidence thresholds. A high precision of 1.00 is achieved at a confidence of 0.928. | 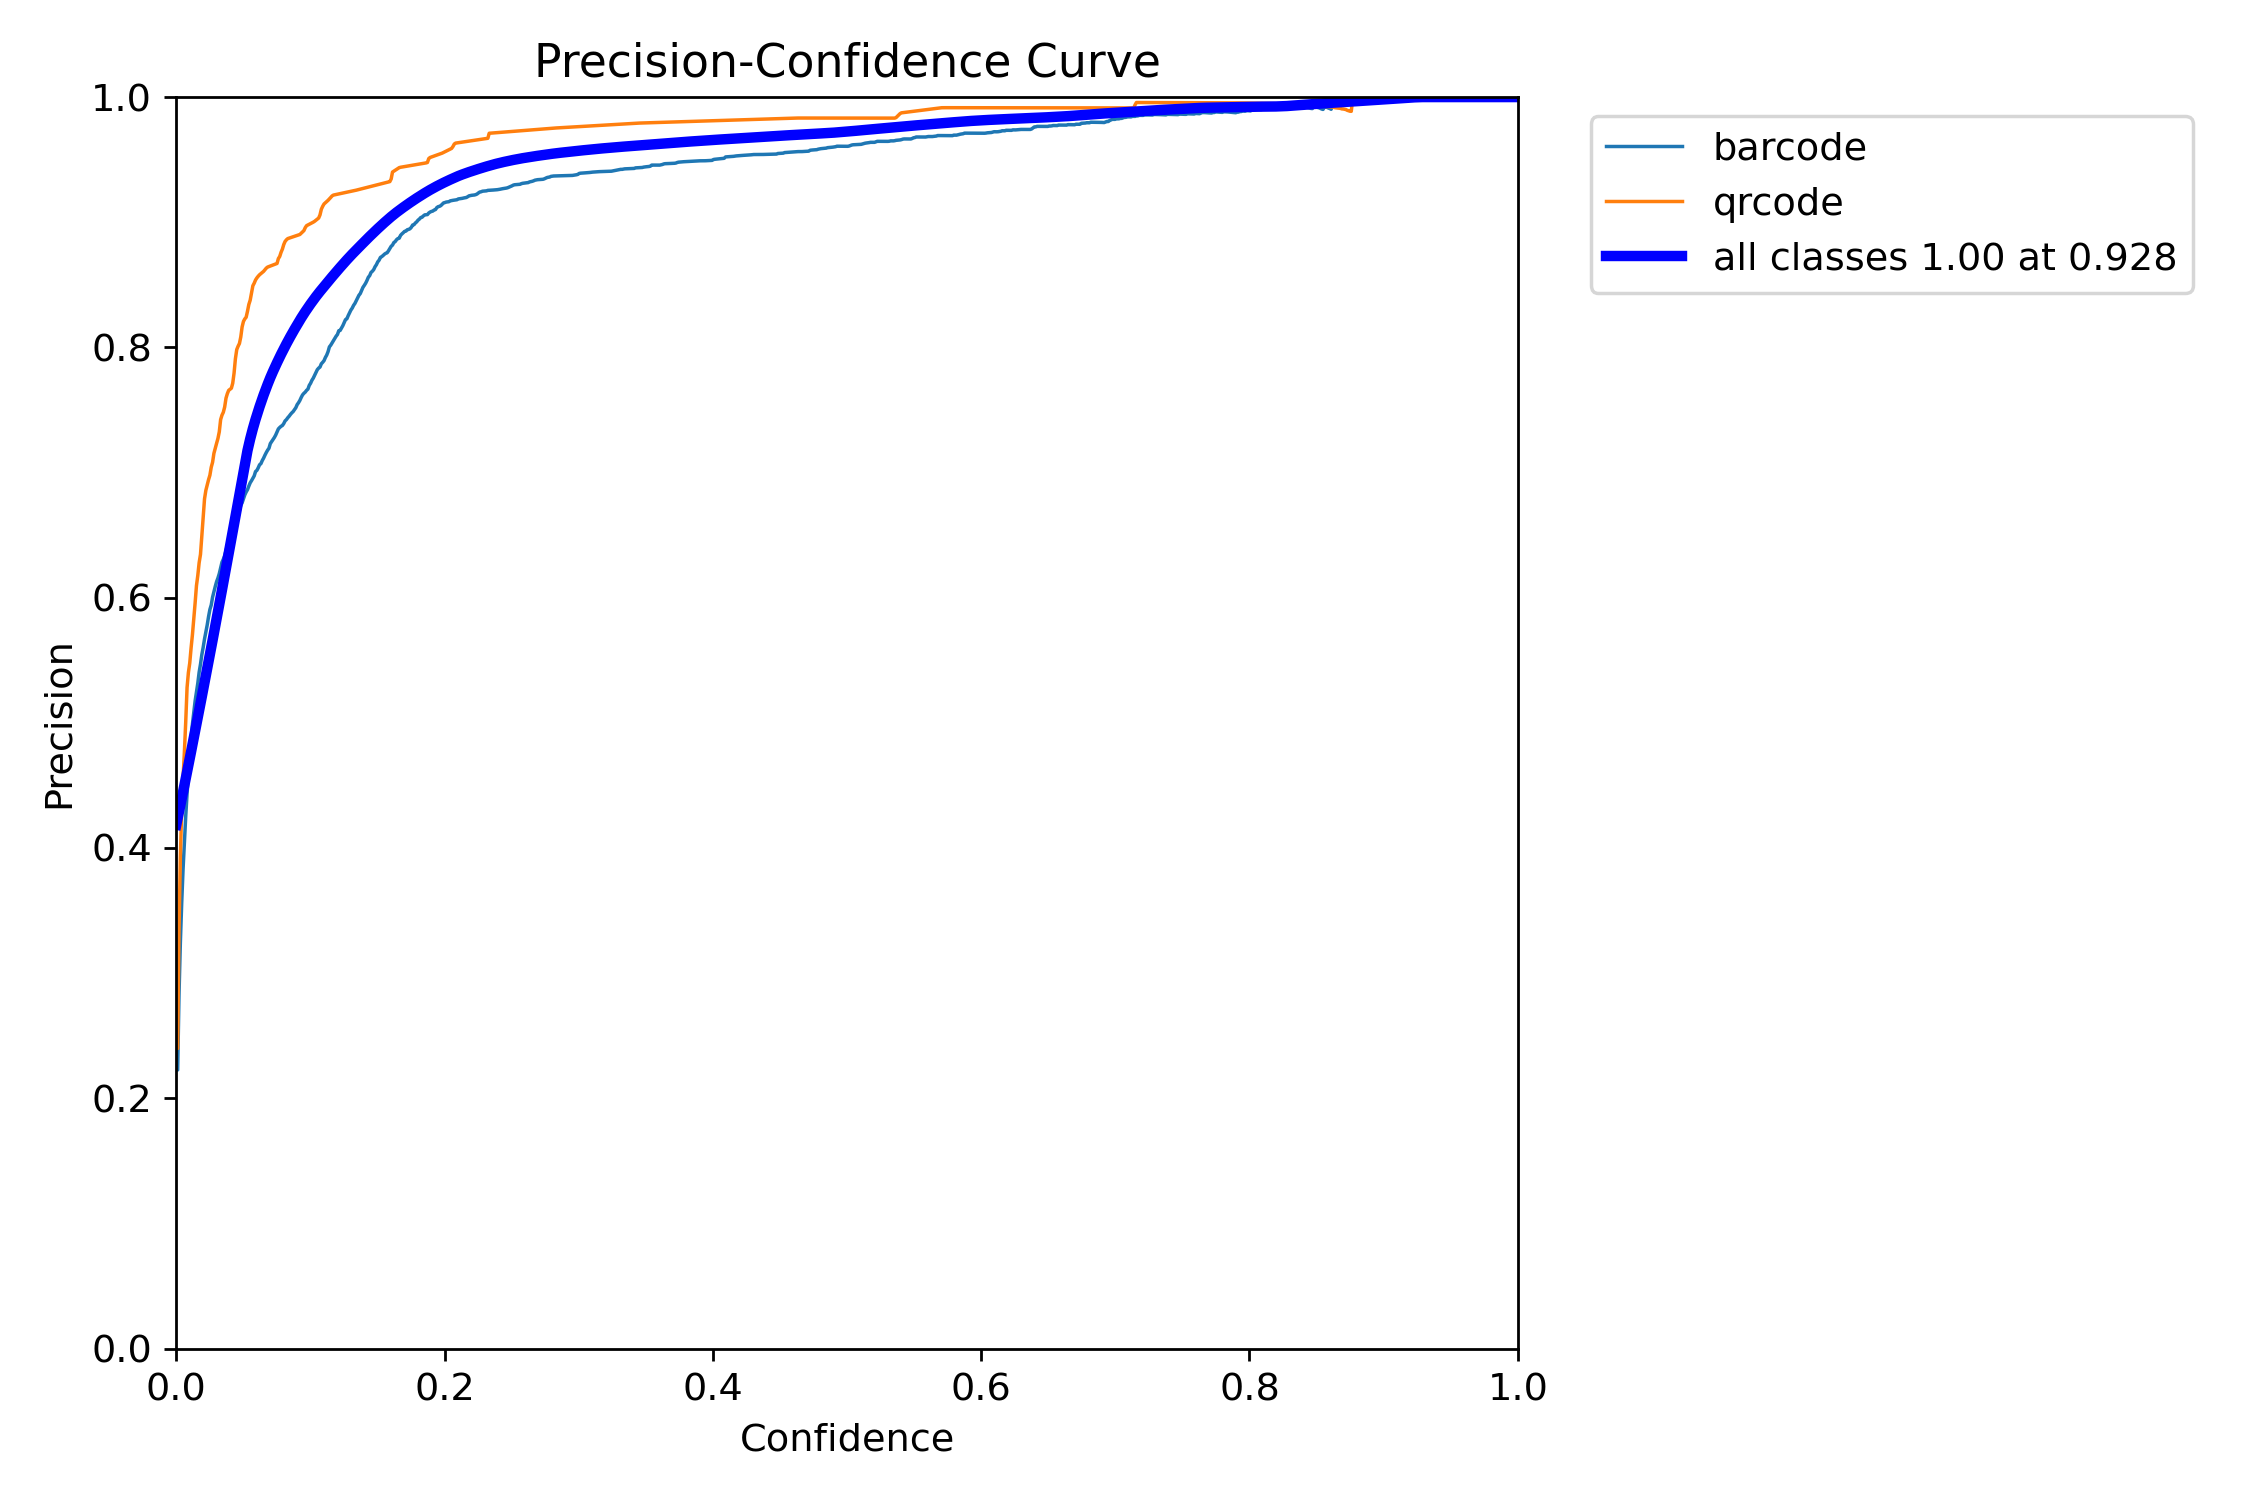 |
| Precision-Recall Curve | The Precision-Recall curve highlights the trade-off between precision and recall. The model achieved an impressive overall mAP@0.5 of 0.986, with individual class scores of 0.979 for barcode and 0.992 for qrcode. | 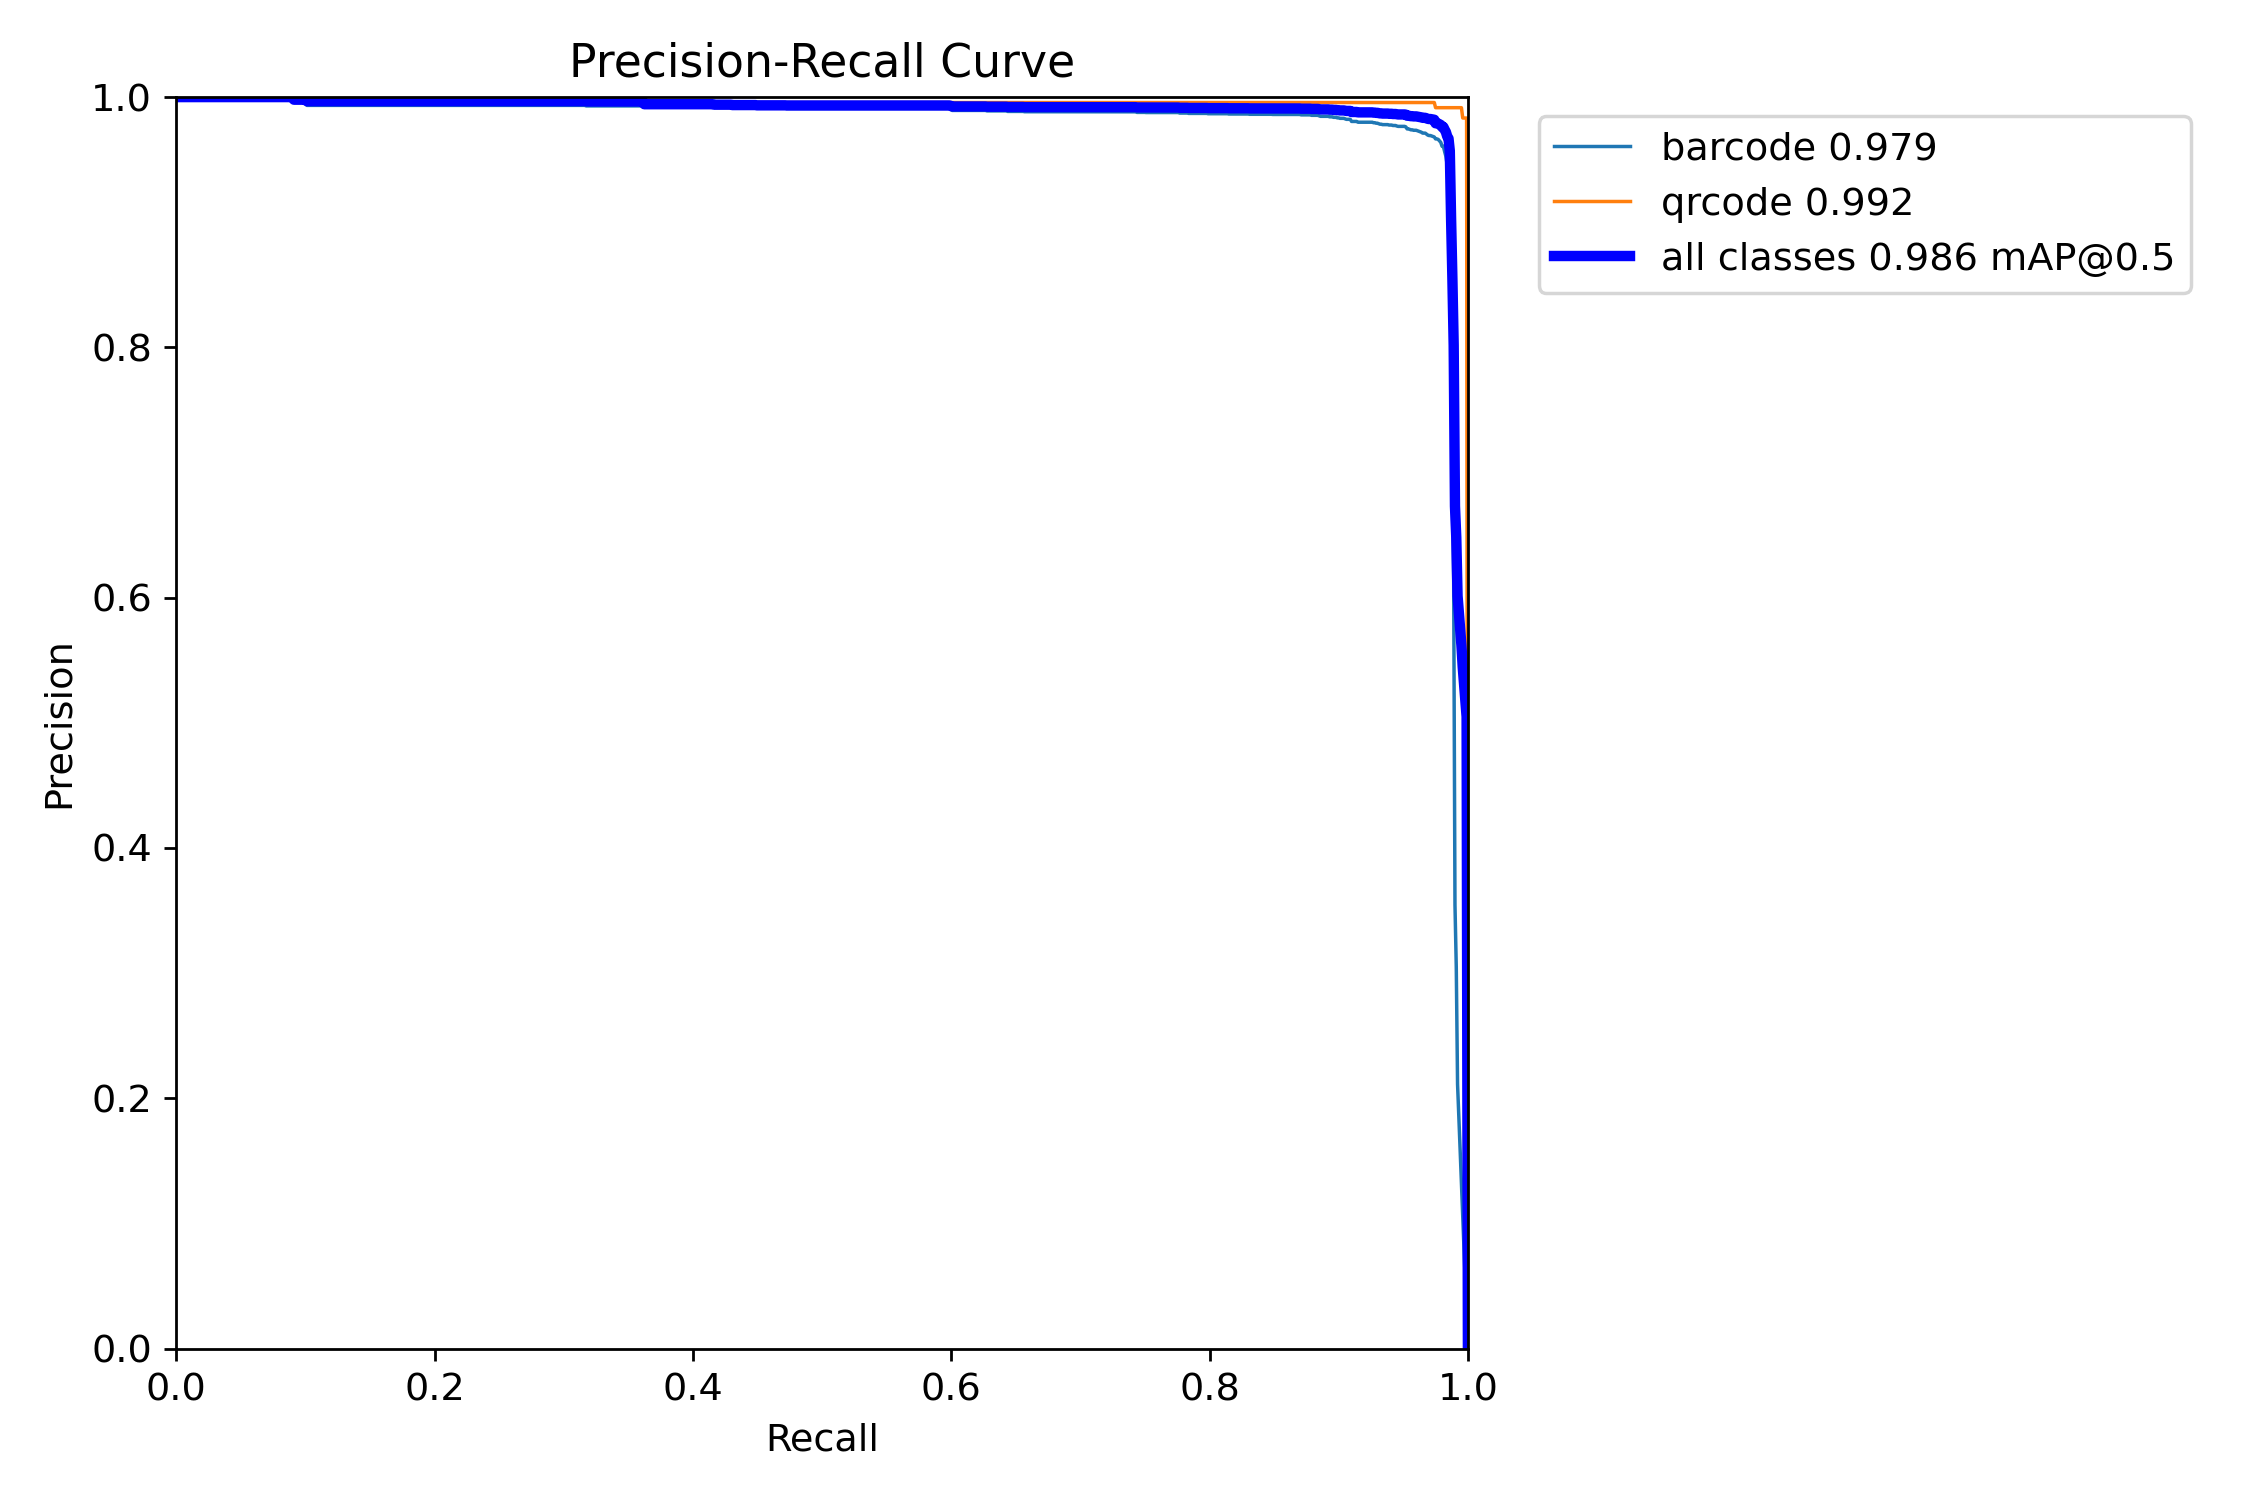 |
| Recall-Confidence Curve | This curve shows the recall performance at different confidence thresholds. | 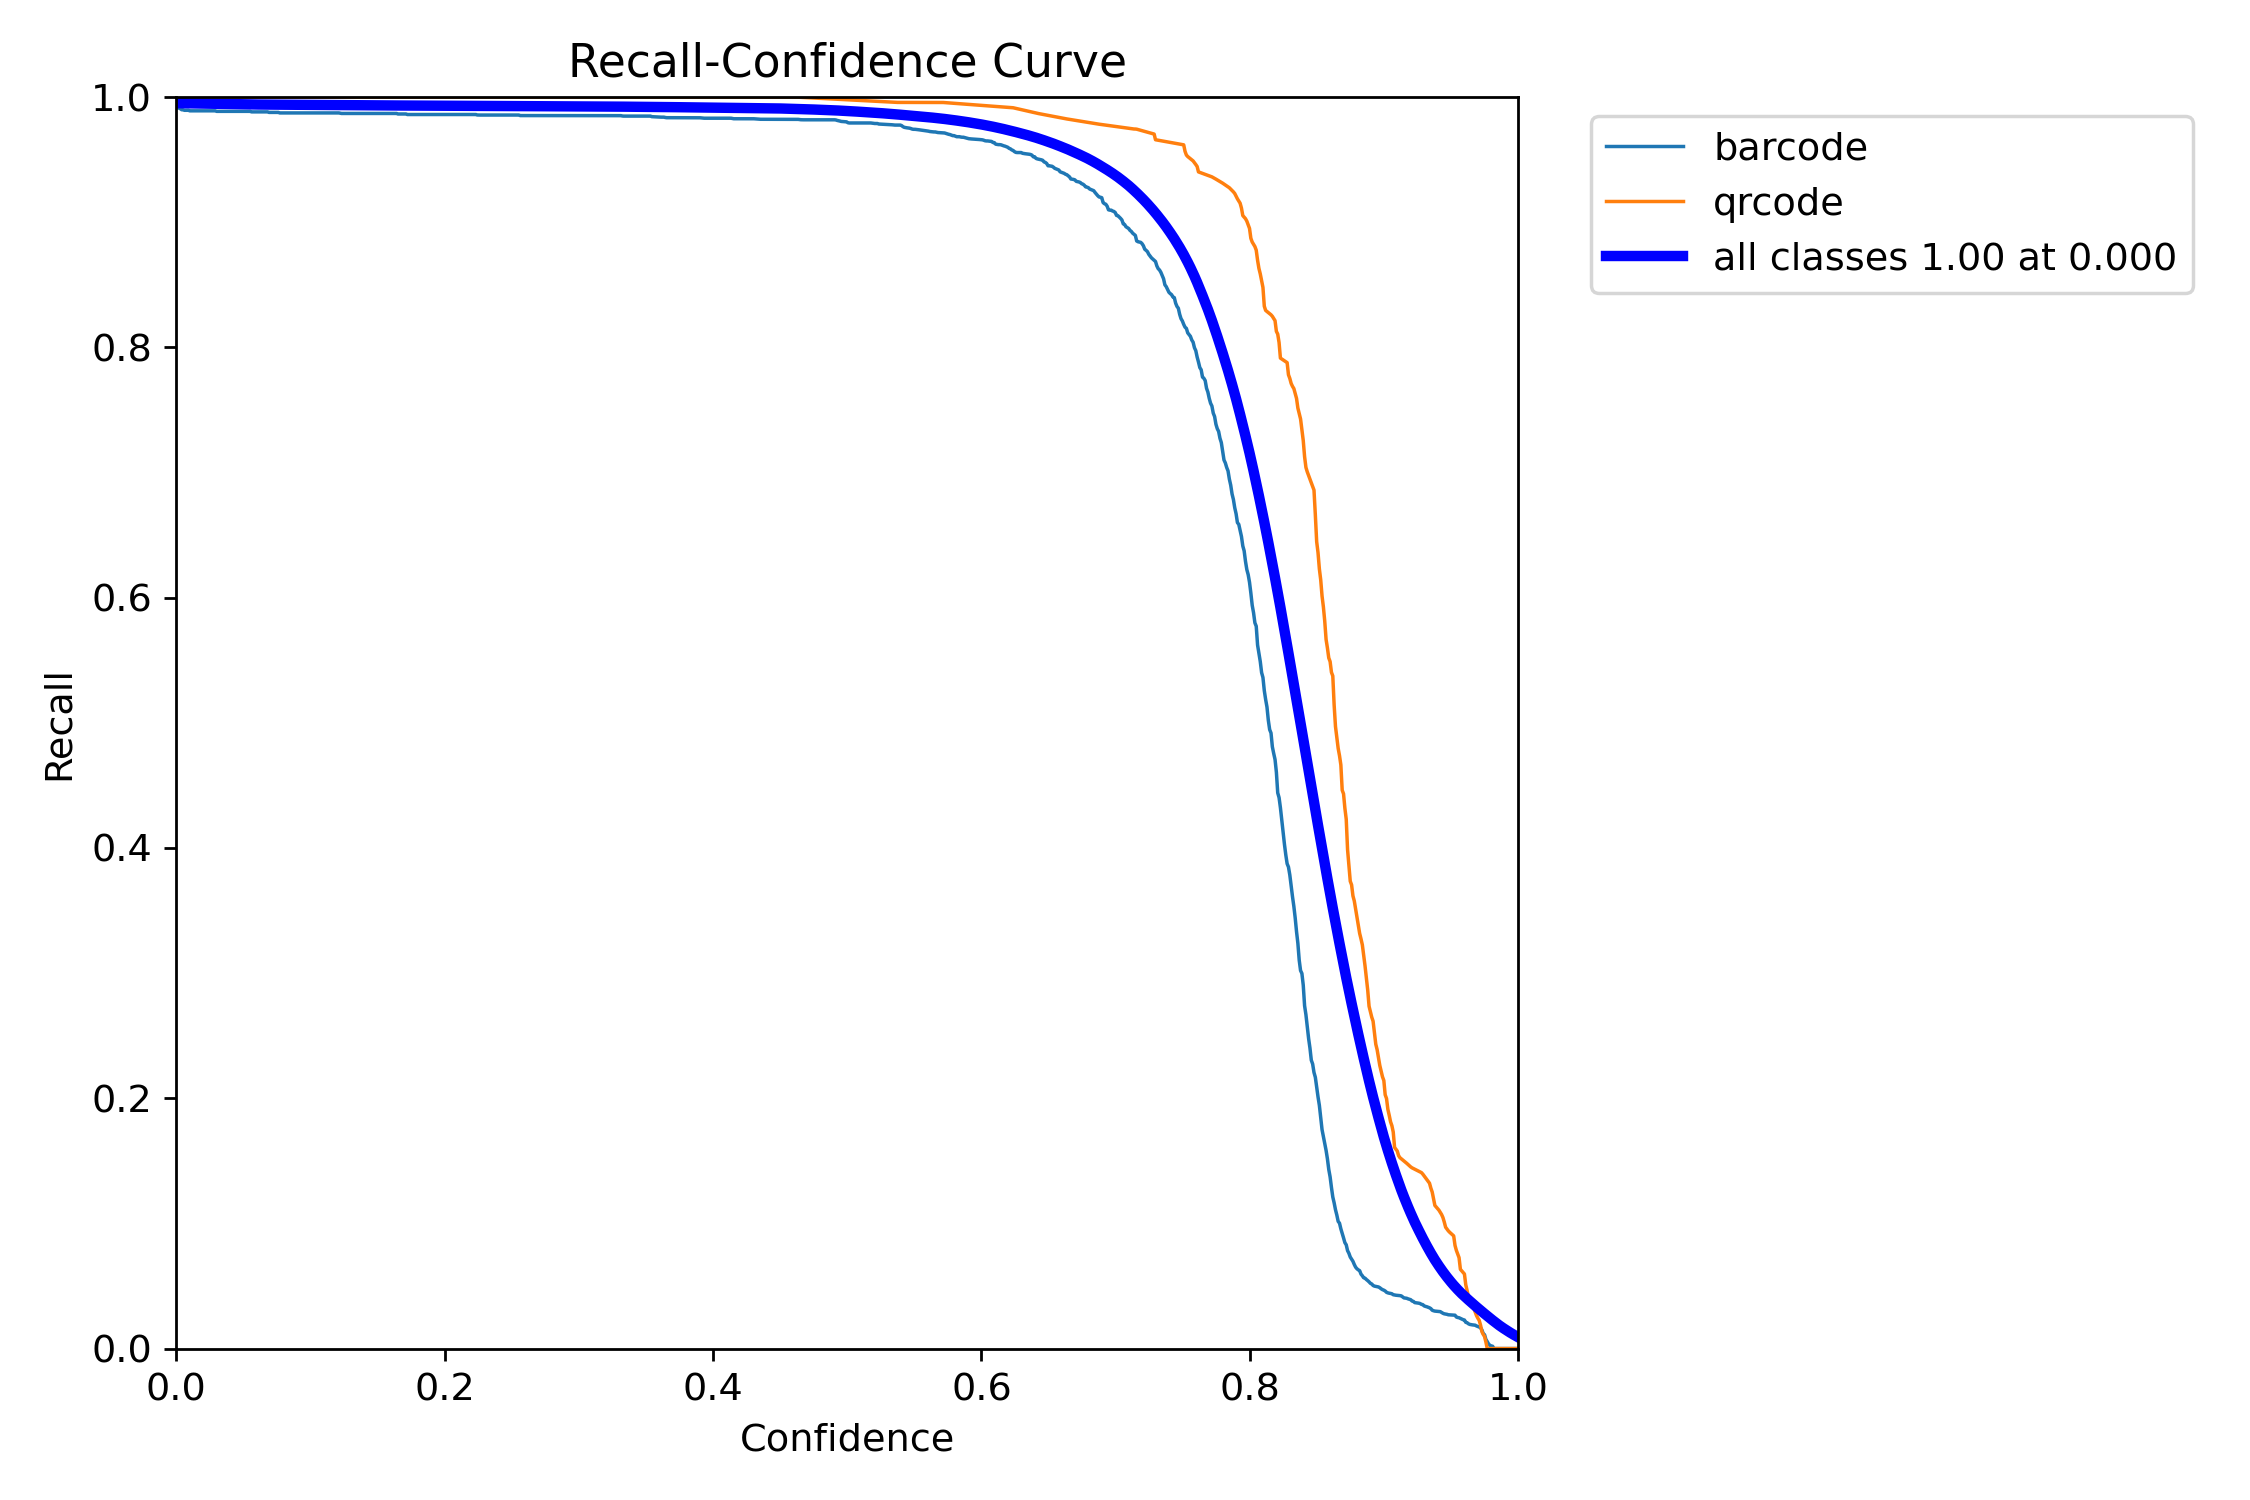 |
| Confusion Matrix (Normalized) | The normalized confusion matrix shows the proportion of true positives, false positives, and false negatives for each class, normalized by the true class count. | 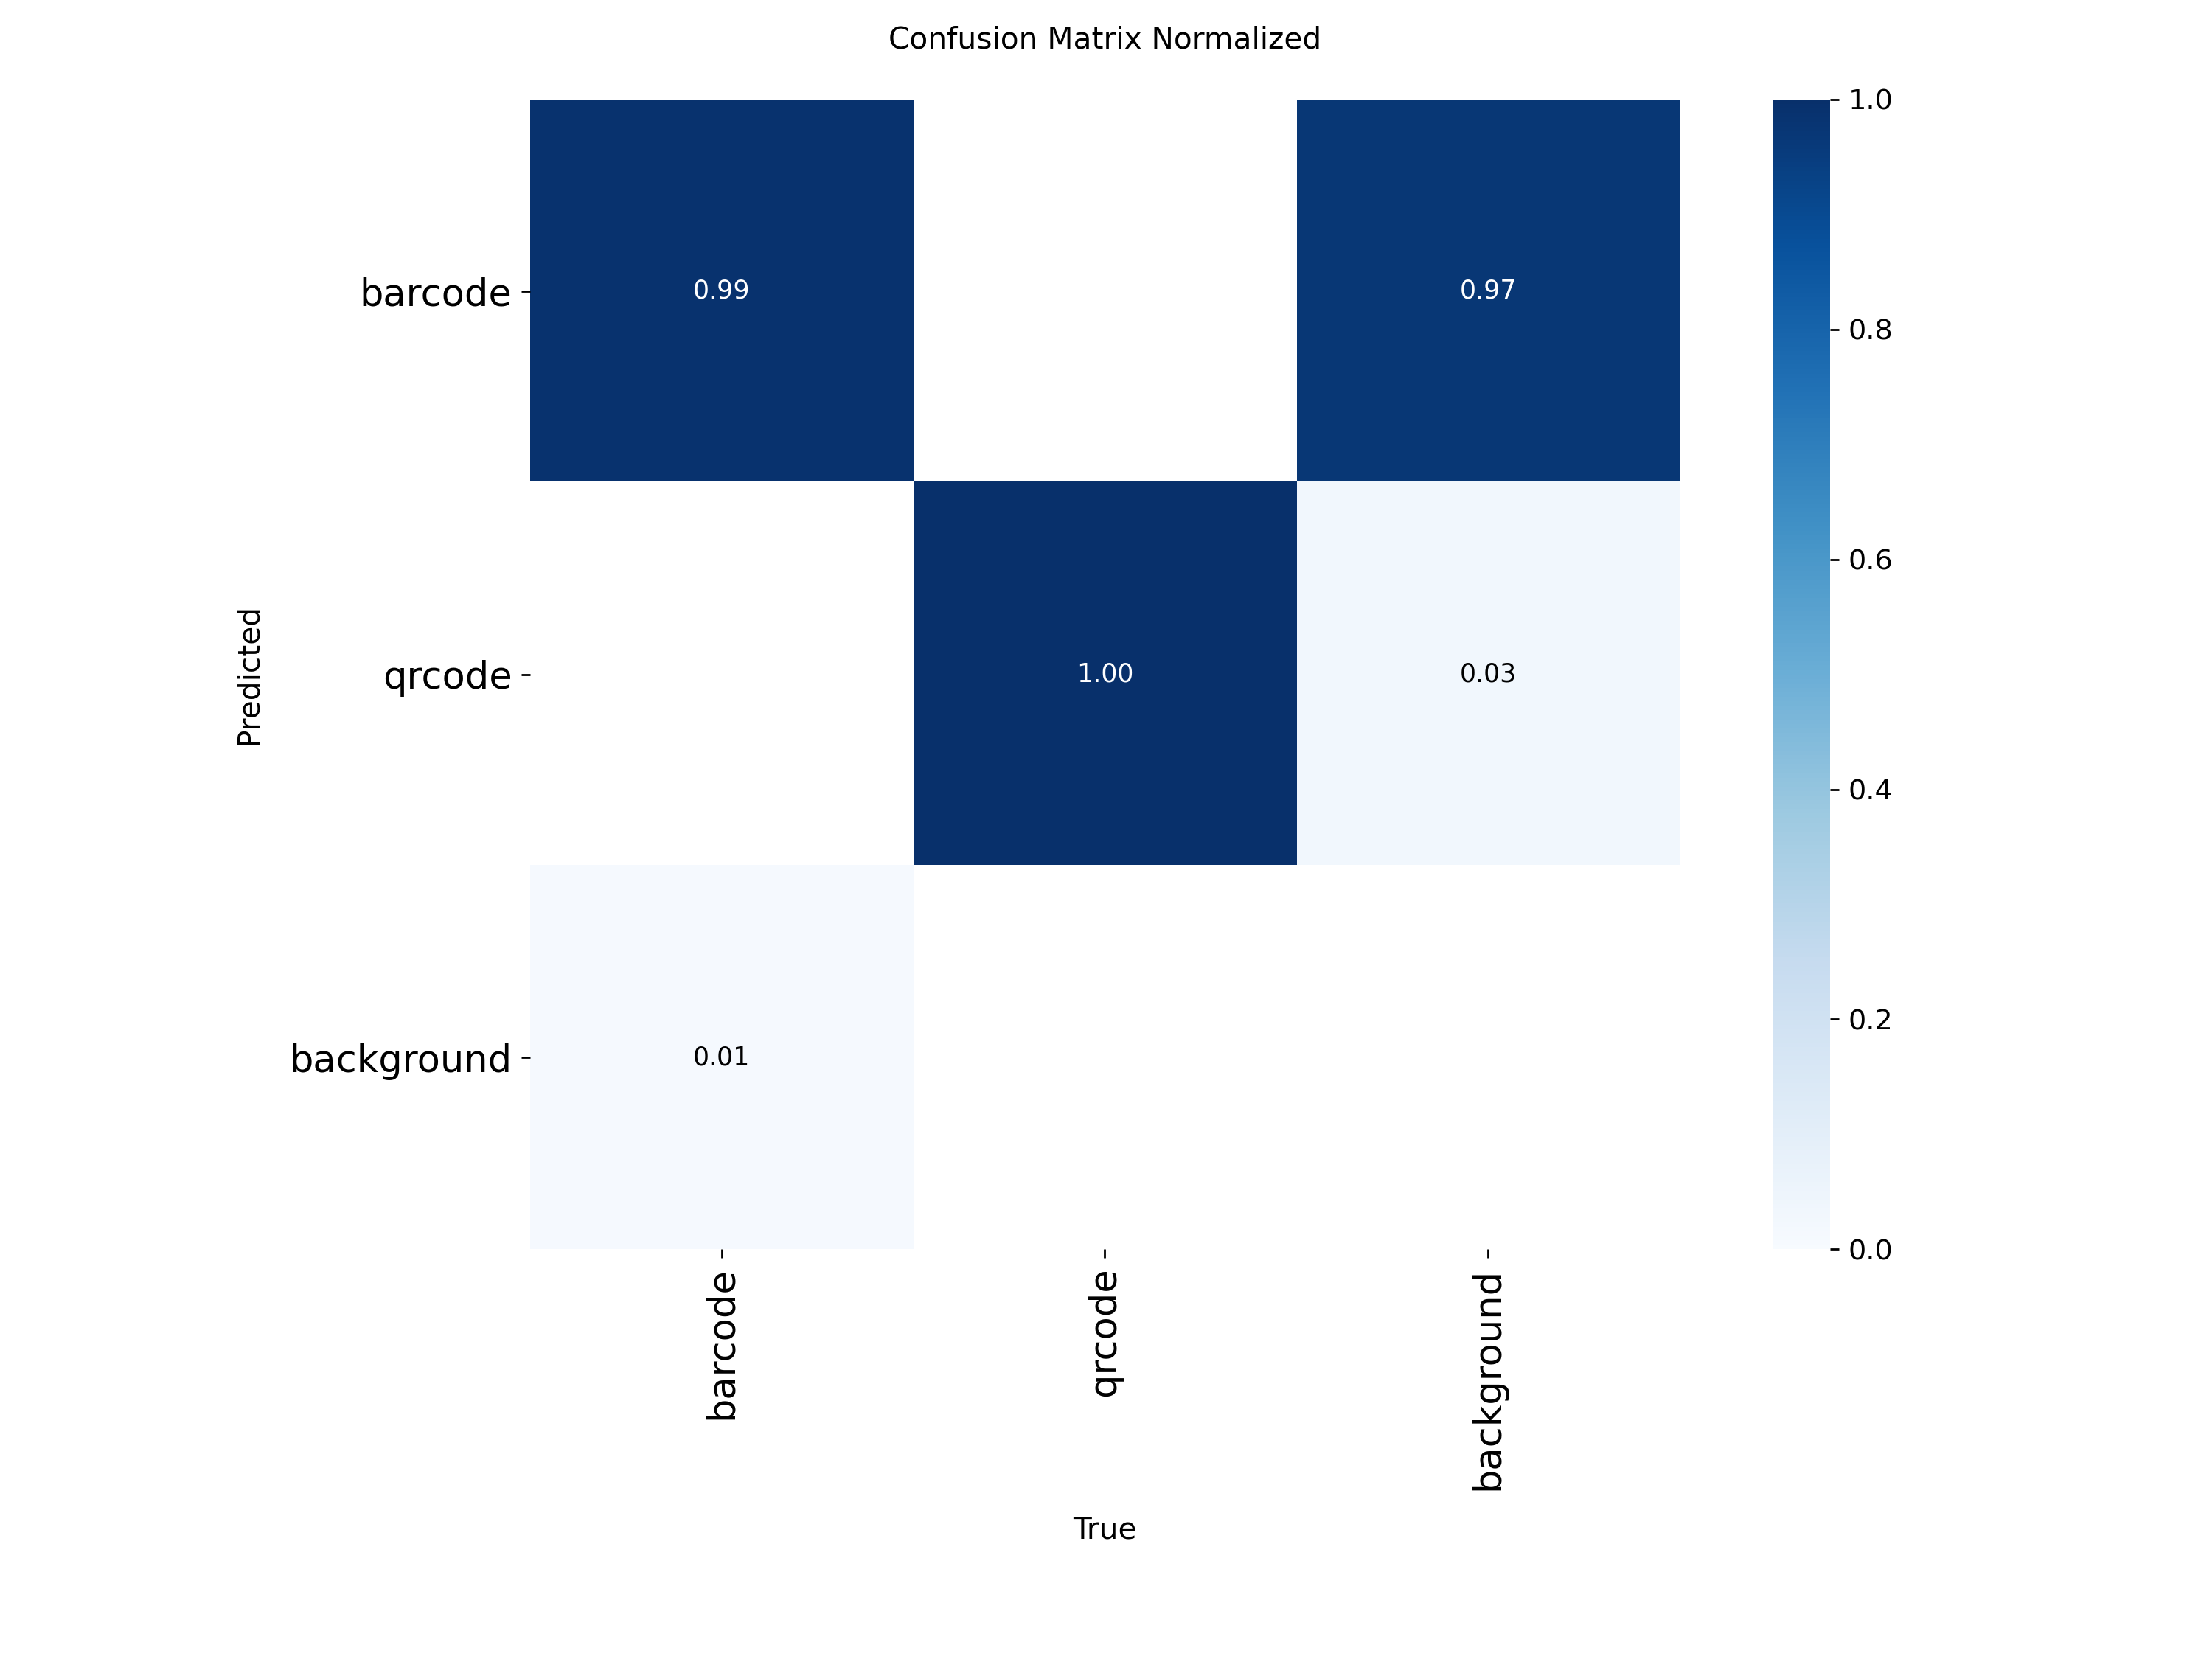 |
| Confusion Matrix (Absolute Counts) | The absolute confusion matrix shows the raw counts of true positives, false positives, and false negatives for each class. | 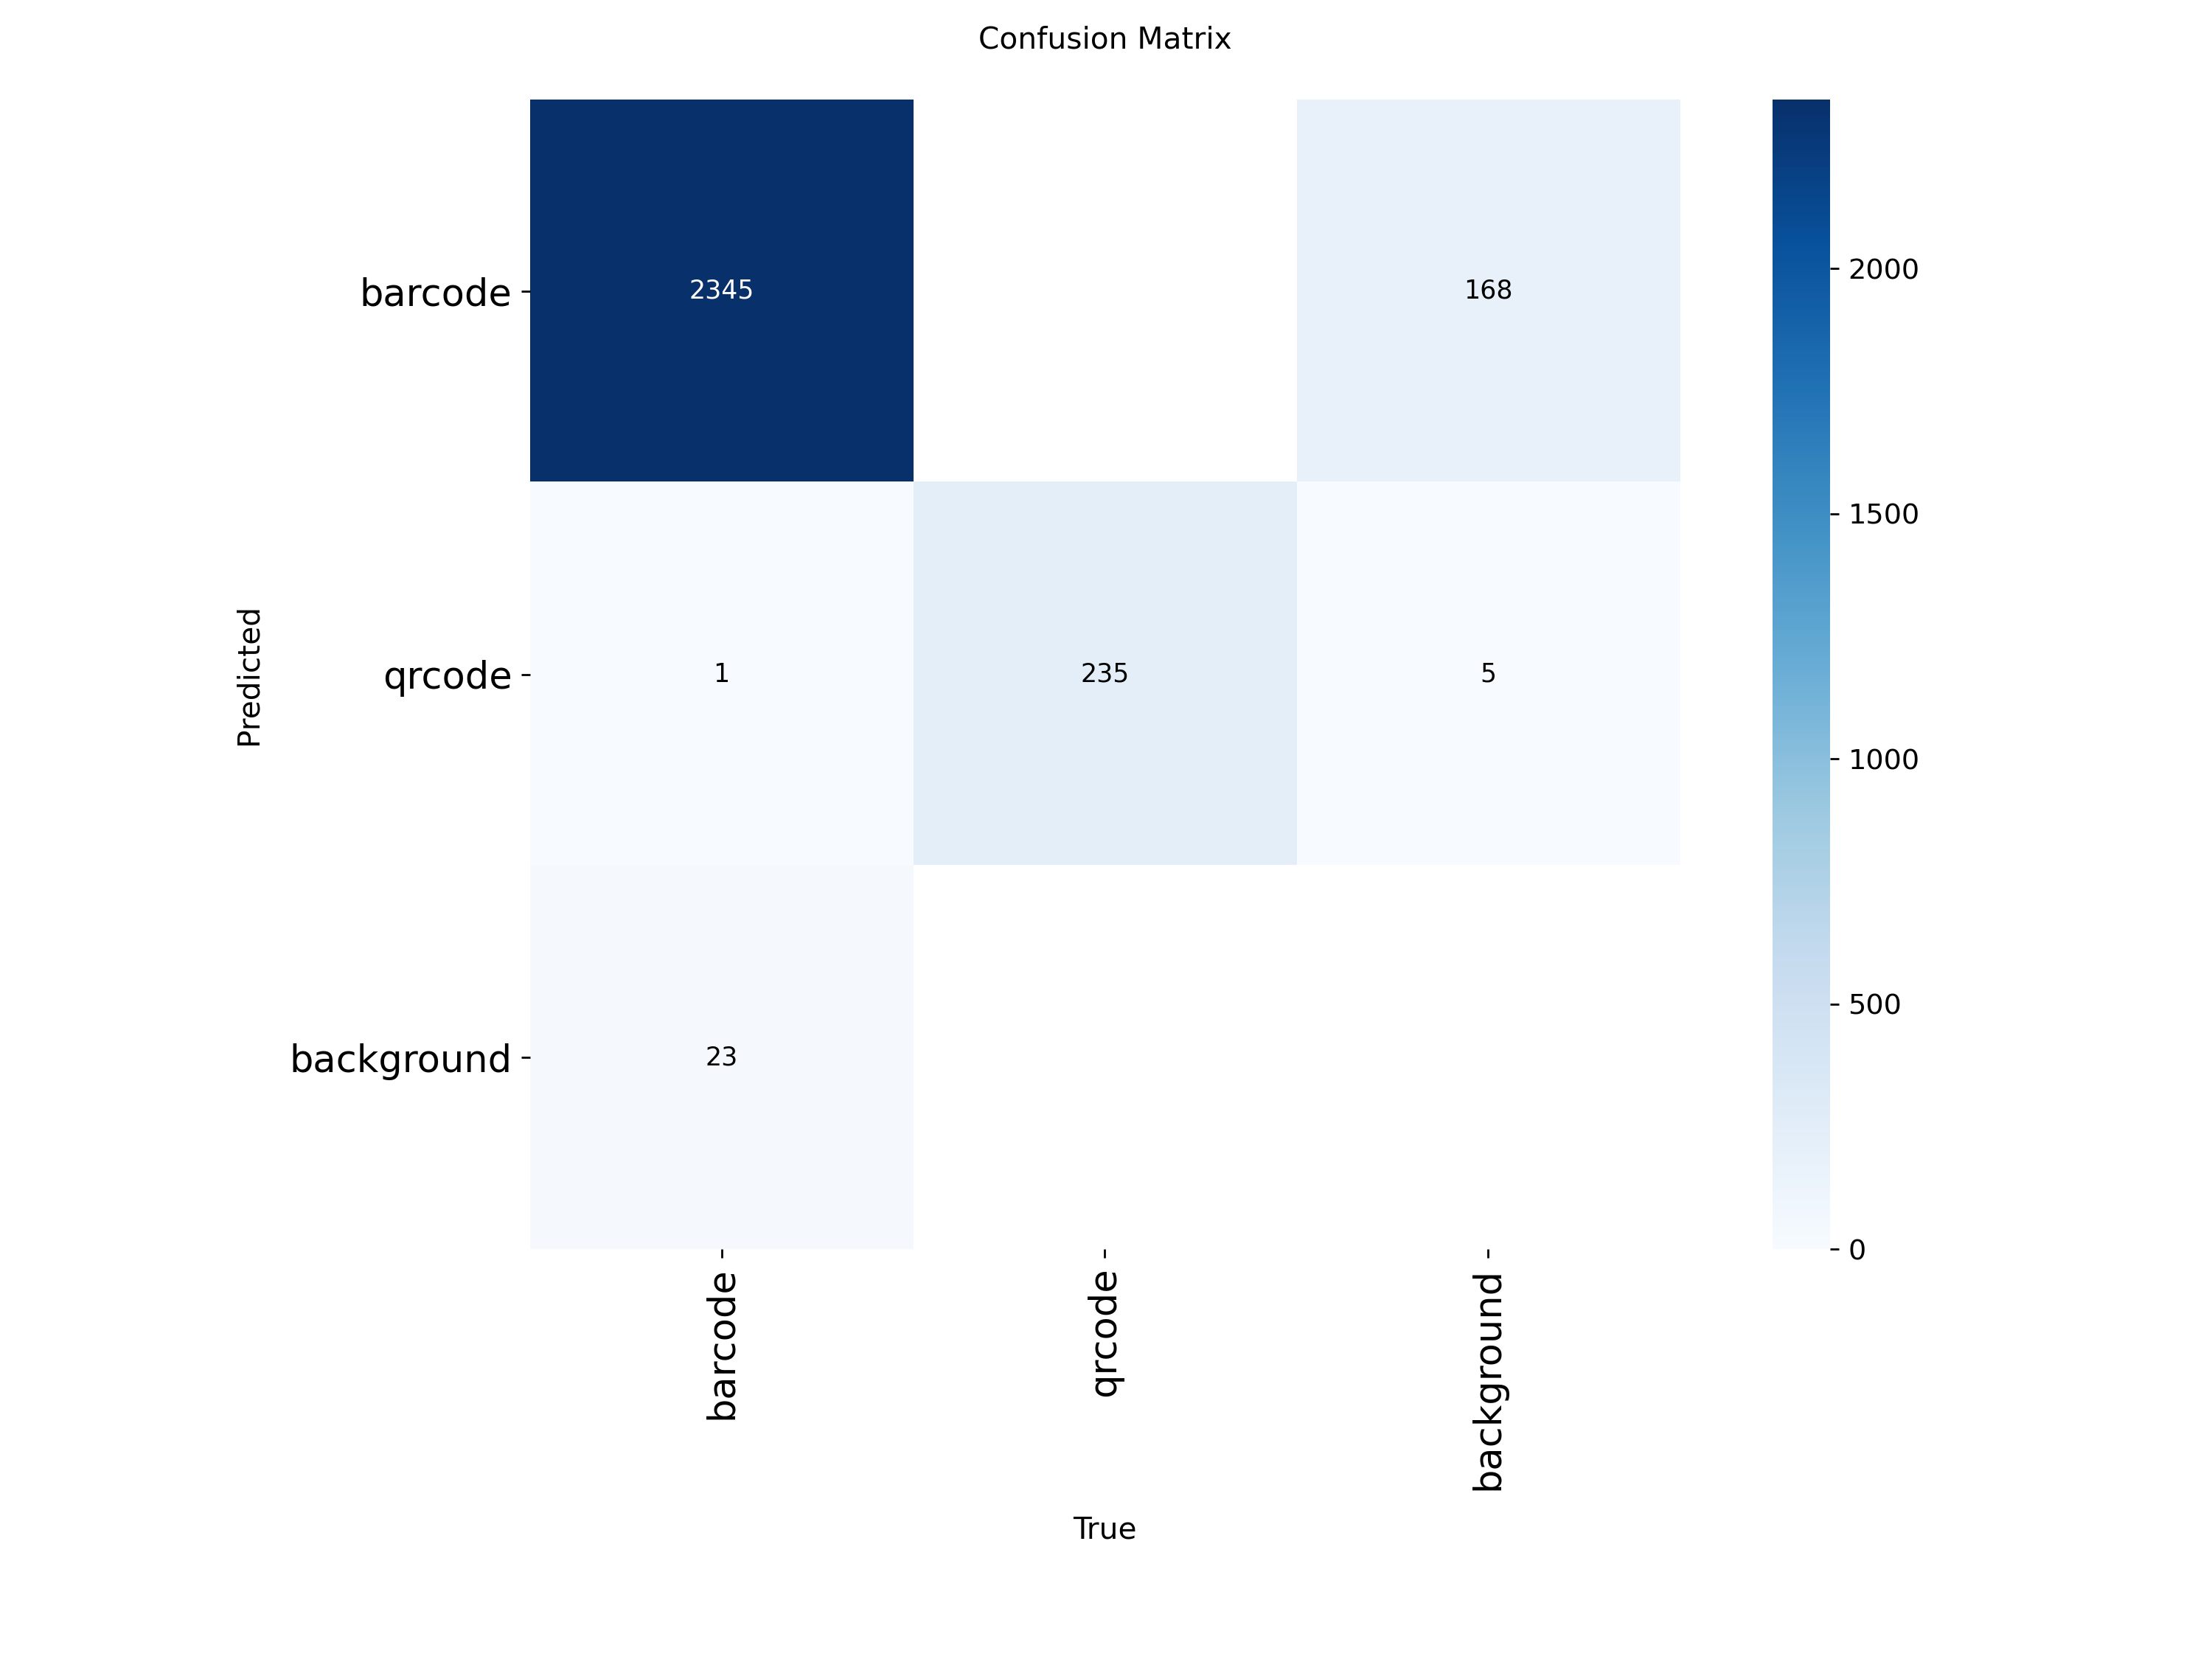 |
| Dataset Distribution | This plot provides insights into the distribution of instances within the dataset, including class counts, bounding box shapes, and centroid locations. | 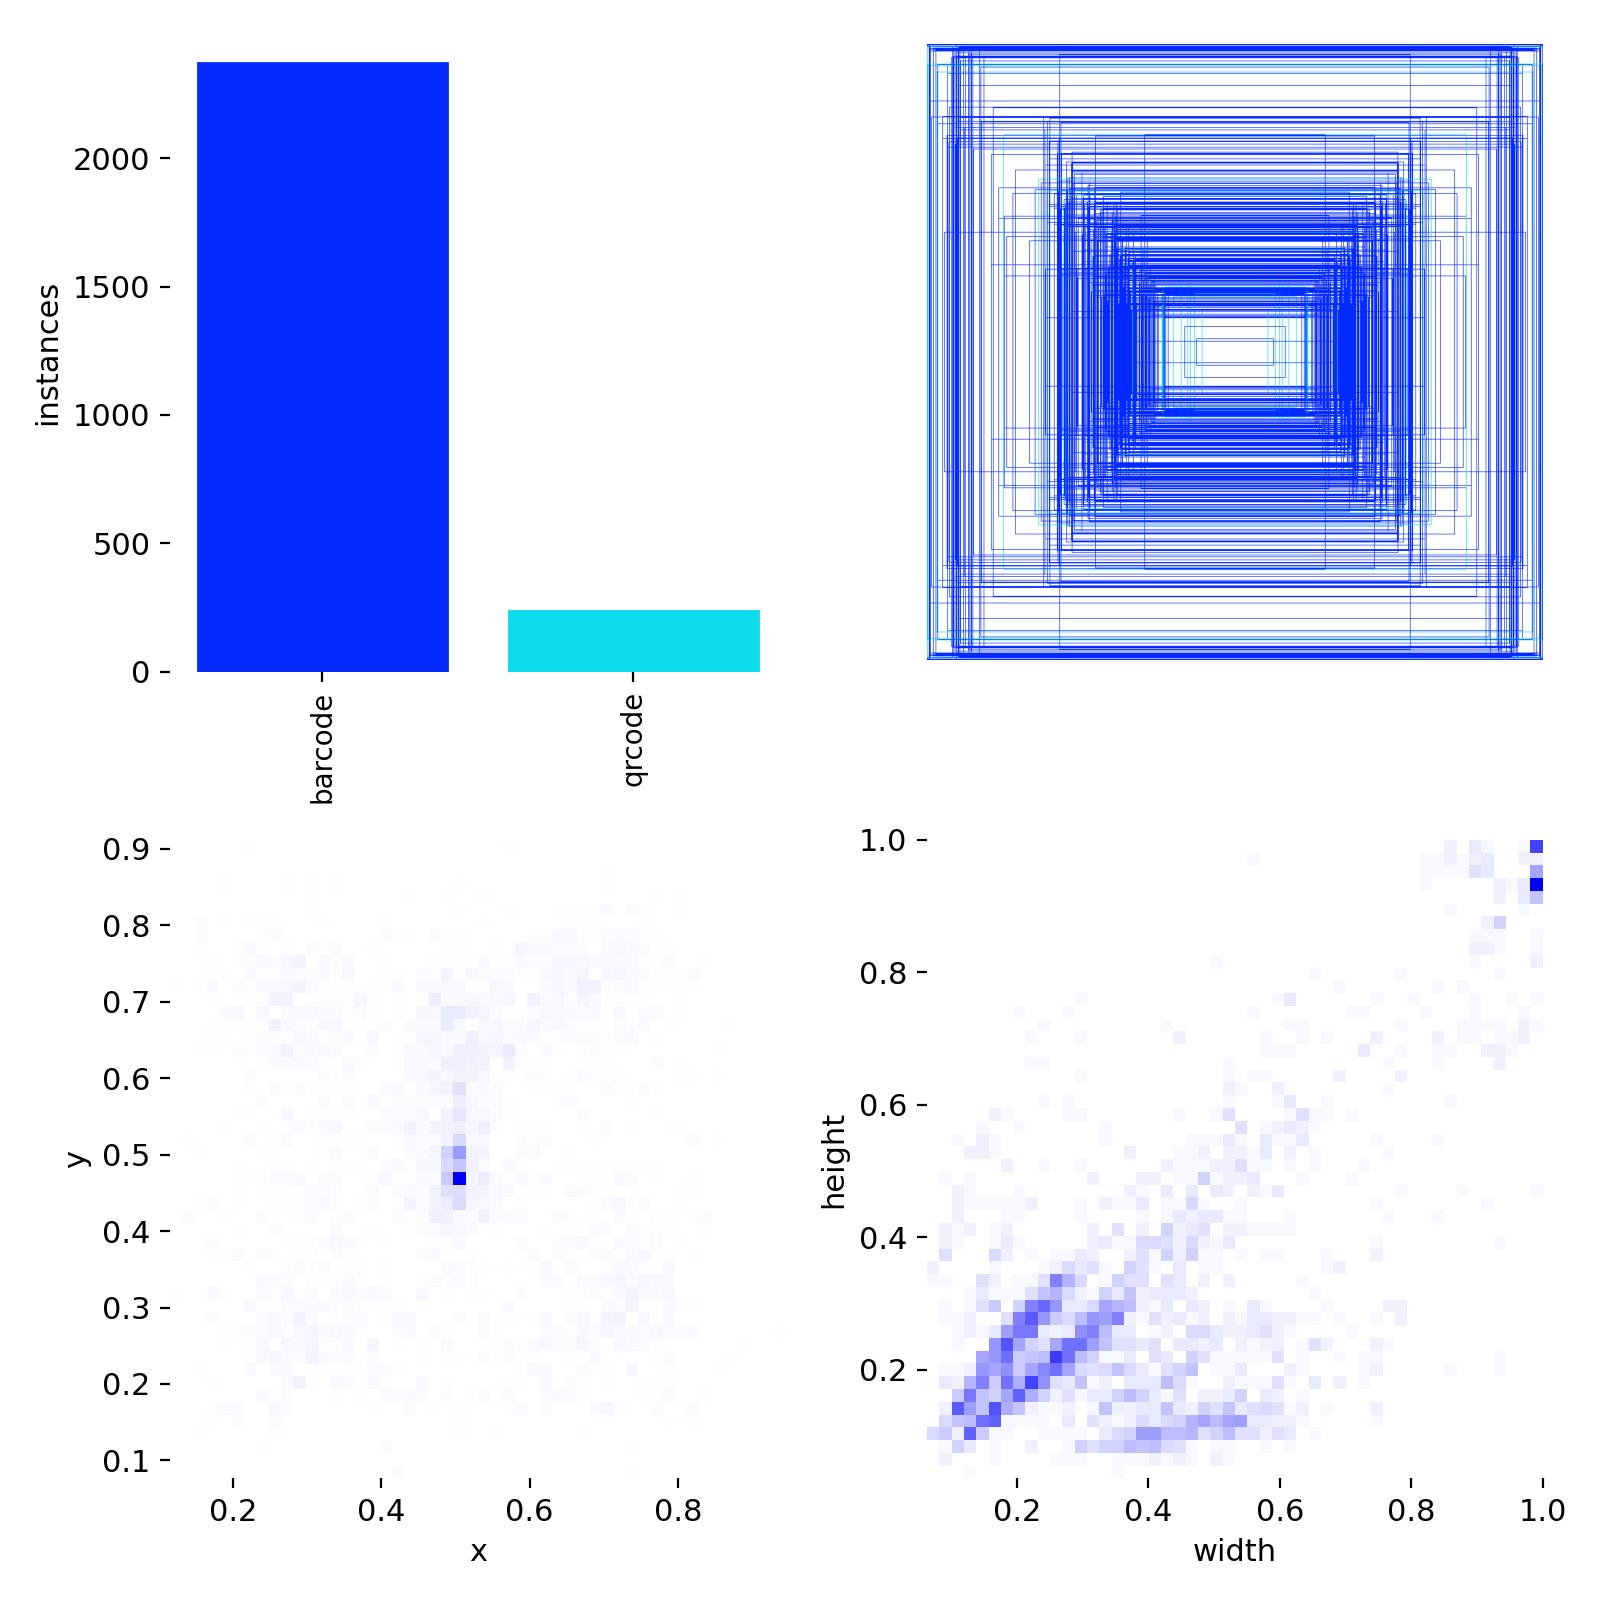 |
| Training & Validation Curves | These plots track the training and validation losses (box, classification, DFL) and performance metrics (precision, recall, mAP) across all epochs, demonstrating the model's learning progression. | 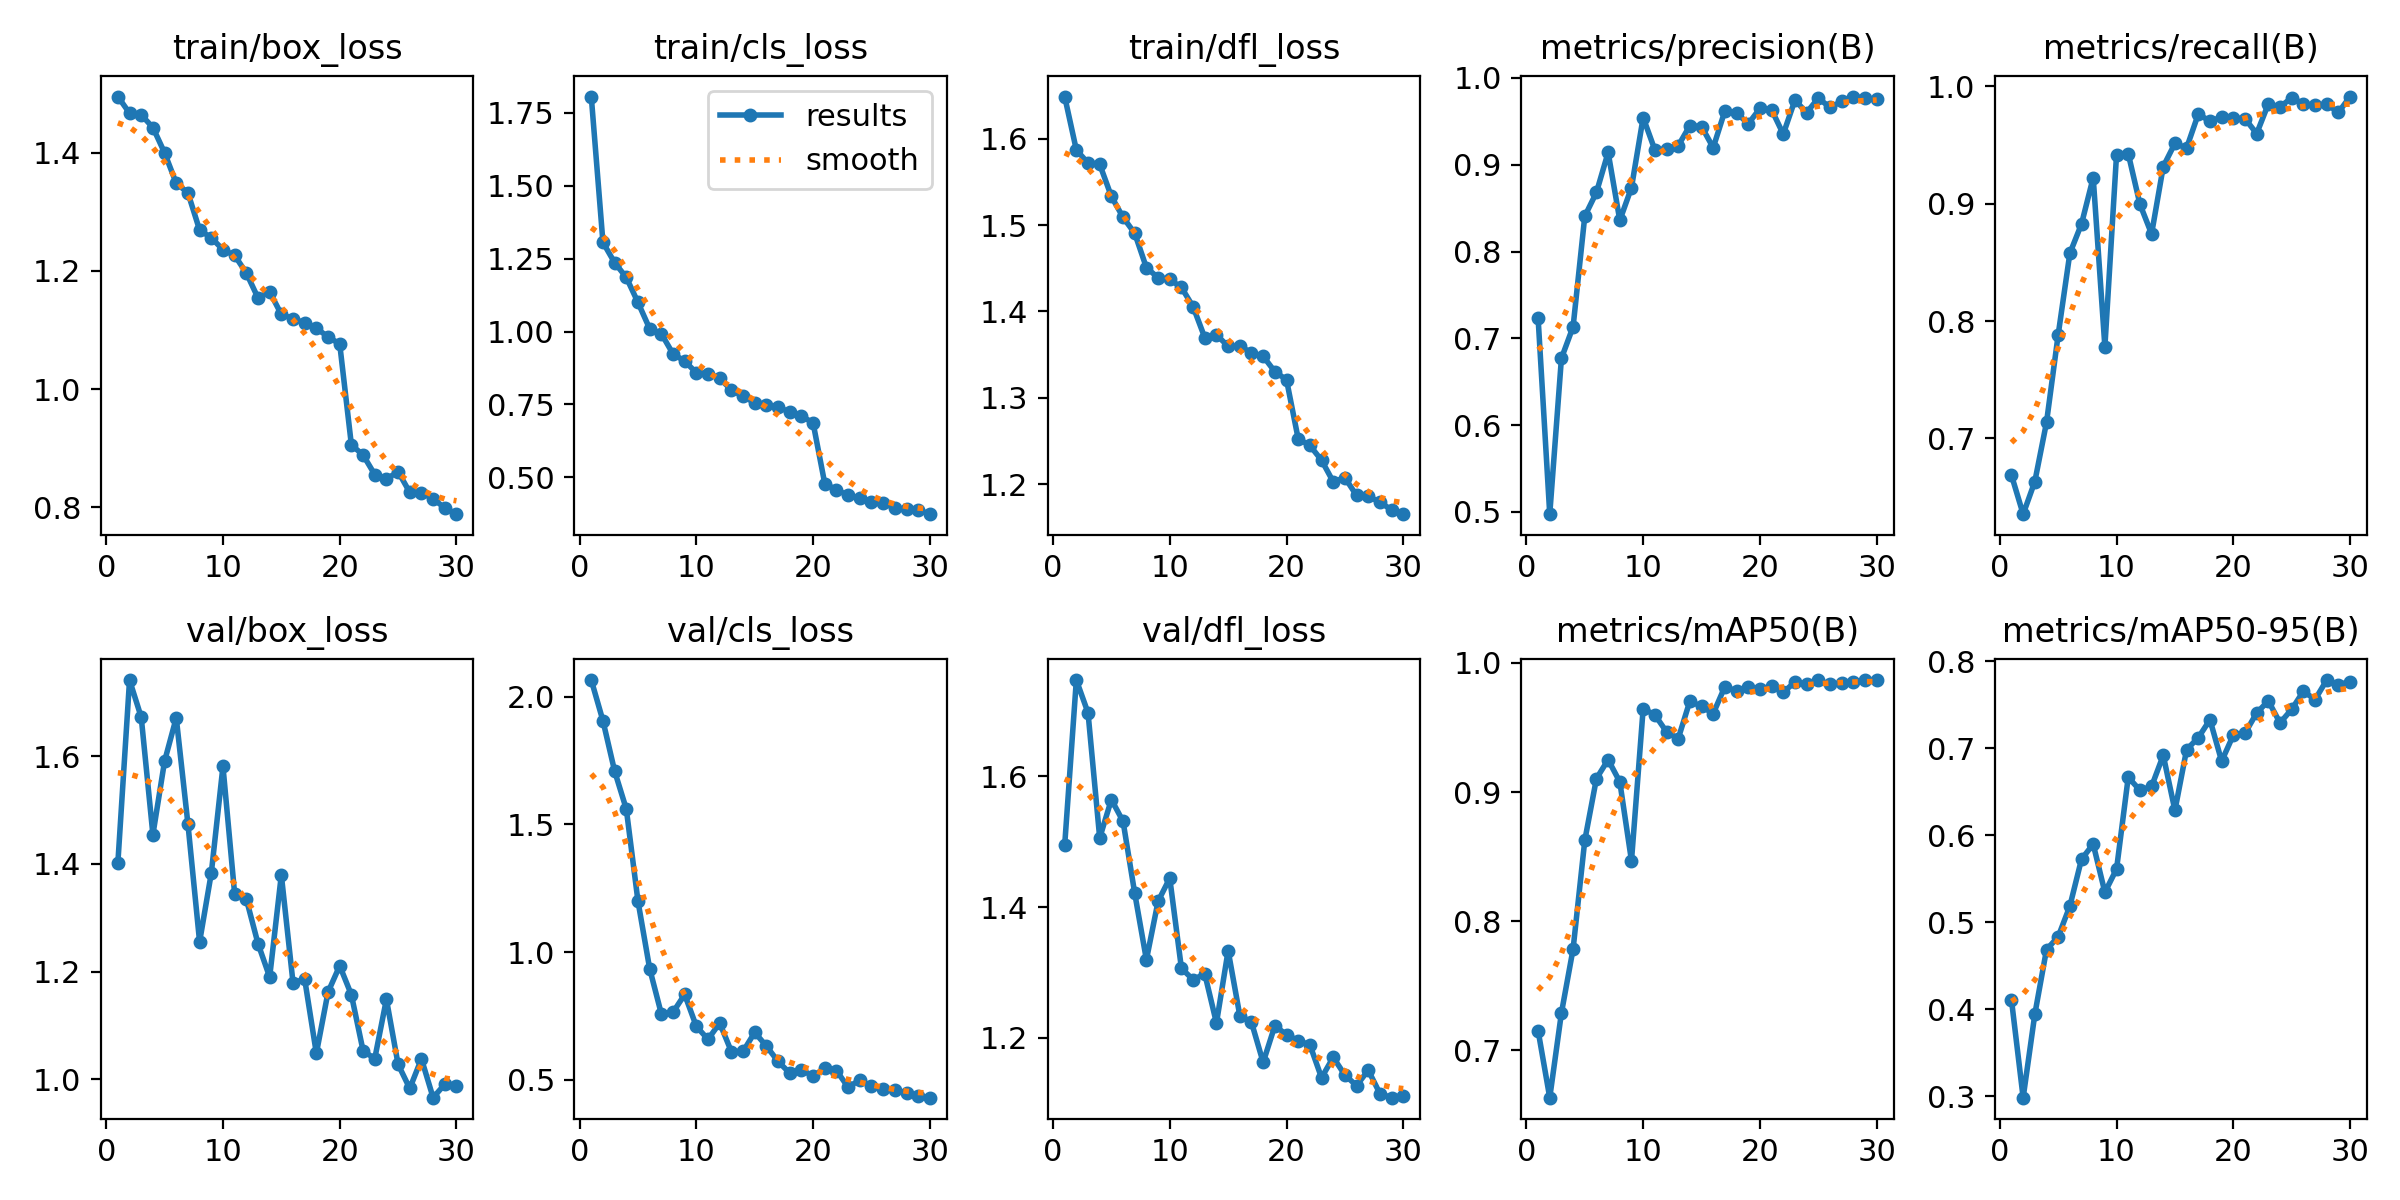 |