** Project Presentation Video**
**click on the video **
this is the url(in case its not working):
🎓 Exam Score Prediction – Full Machine Learning Pipeline
Author: ori manor
Assignment 2 – Regression, Classification, Clustering & Evaluation
A complete end-to-end ML project covering:
✔ EDA
✔ Research Questions
✔ Regression Models
✔ Feature Engineering
✔ Clustering
✔ Classification
✔ Model Selection & Deployment
📑 Table of Contents
- Dataset Overview
- Part 2 – Exploratory Data Analysis (EDA)
- Part 2B – Research Questions
- Part 3 – Regression Modeling
- Part 4 – Feature Engineering
- Part 5 – Improved Regression Models
- Part 6 – Clustering
- Part 7 – Regression → Classification
- Part 8 – Classification Models
- Final Model Selection
- How to Use the Saved Models
📘 Dataset Overview
The dataset contains 20,000 students described by academic, demographic, lifestyle, and behavioral indicators.
Main Features
| Category | Features |
|---|
| Academic | study_hours, class_attendance, exam_score, exam_difficulty |
| Lifestyle | sleep_hours, sleep_quality |
| Demographic | age, gender |
| Preferences | study_method, facility_rating, course |
| Engineered | pca_1, pca_2, cluster_id, distance_to_centroid, sleep_study_ratio |
Targets
- Regression:
exam_score
- Classification: Low / Medium / High (quantile-based)
🔍 Part 2 – Exploratory Data Analysis (EDA)
Below are representative visualizations demonstrating trends, distributions, correlations, and relationships.
📊 2.1 Exam Score Distribution
 Score Distribution
Insights
- Distribution is close to normal, centered around ~62
- Great baseline for regression models
- No extreme skew → stable modeling behavior
📘 2.2 Correlation Heatmap
 Corr Matrix
Key Findings
✔ study_hours, class_attendance, and sleep_hours strongly correlate with performance
✔ No significant multicollinearity
✔ Behavioral variables dominate score prediction
📈 2.3 Study Hours vs Exam Score
 Study Hours vs Score
Insight
Clear linear trend:
More study hours → higher score.
Diminishing returns appear after ~8–9 hours/day.
🧍 2.4 Gender Distribution
 Gender
Balanced representation supports fair modeling.
🔬 Part 2B – Research Questions
RQ1: Does class attendance impact score?
 Attendance vs Score
Insight
Strong positive effect.
Students with high attendance show significantly higher average scores.
RQ2: Does sleep quality matter?
 Sleep Quality
Insight
Good sleepers outperform poor sleepers by ~10 points.
Sleep quality meaningfully affects academic output.
RQ3: Which study method performs best?
 Study Method
Ranking
1️⃣ Coaching
2️⃣ Mixed
3️⃣ Online
4️⃣ Self-study (lowest)
RQ4: Age vs Exam Score
 Age vs Score
Insight
Age is not a meaningful predictor.
Scores remain constant across age groups.
📉 Part 3 – Regression Modeling
Baseline model: Simple Linear Regression.
3.1 Actual vs Predicted
 Actual vs Predicted
Interpretation
Predictions align closely with the diagonal → strong model calibration.
3.2 Residual Distribution
 Residuals
Insight
Residuals approximate a normal distribution → assumptions of linear regression hold.
🛠️ Part 4 – Feature Engineering
Includes:
✔ One-hot encoding
✔ Scaling
✔ PCA (2 components)
✔ KMeans clustering
✔ Ratios (sleep_study_ratio)
PCA + KMeans Visualization
 Clusters
Cluster meanings
- Cluster 0: low study / low attendance
- Cluster 1: mixed behavior
- Cluster 2: high-performance disciplined group
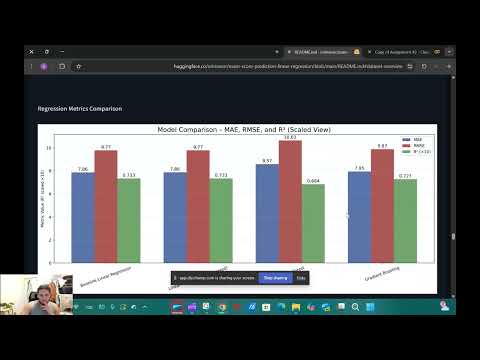
📈 Part 5 – Improved Regression Models
Models evaluated:
- Linear Regression (engineered)
- Random Forest
- Gradient Boosting
Regression Metrics Comparison
 Regression Comparison
Summary Table
| Model | R² | RMSE | Conclusion |
|---|
| Linear Regression | 0.733 | 9.77 | ⭐ Best regression model |
| Engineered Linear Regression | 0.732 | 9.77 | Similar performance |
| Random Forest | 0.693 | 10.63 | Slight overfitting |
| Gradient Boosting | 0.729 | 9.84 | Good but not best |
🌀 Part 6 – Clustering
Clustering adds nonlinear structure that improves tree-based models.
KMeans (k=3) used with PCA projections for insight into behavioral groupings.
🔄 Part 7 – Regression → Classification
Exam scores converted into equal-sized quantile buckets:
- Low (bottom 33%)
- Medium (middle 33%)
- High (top 33%)
Classes remain balanced, supporting reliable evaluation.
🧪 Part 8 – Classification Modeling
Models trained:
- Logistic Regression
- Random Forest
- Gradient Boosting
Performance mainly judged by recall, important for identifying struggling students.
Confusion Matrices
Logistic Regression
 LogReg
Random Forest
 RF
RFGradient Boosting
 GB
GB
Classification Insights
- Most misclassifications occur between Medium ↔ High
- Low scores are easiest to detect
- Logistic Regression performs best overall
✔ highest macro recall
✔ stable generalization
✔ interpretable
🏆 Final Selected Models
Regression Winner
✔ Linear Regression
File: winning_model.pkl
Classification Winner
✔ Logistic Regression
File: winning_classification_model.pkl
Chosen for:
- Consistent performance
- Low overfitting
- High interpretability
- Best recall balance
💻 How to Use the Saved Model
1import pickle
2import numpy as np
3
4with open("winning_classification_model.pkl", "rb") as f:
5    model = pickle.load(f)
6
7example = np.array([your_feature_vector]).reshape(1, -1)
8prediction = model.predict(example)
9print(prediction)
✅ End of README
Feel free to open an issue or reach out for improvements.